Estimated Value: $284,000 - $292,000
3
Beds
2
Baths
1,598
Sq Ft
$180/Sq Ft
Est. Value
About This Home
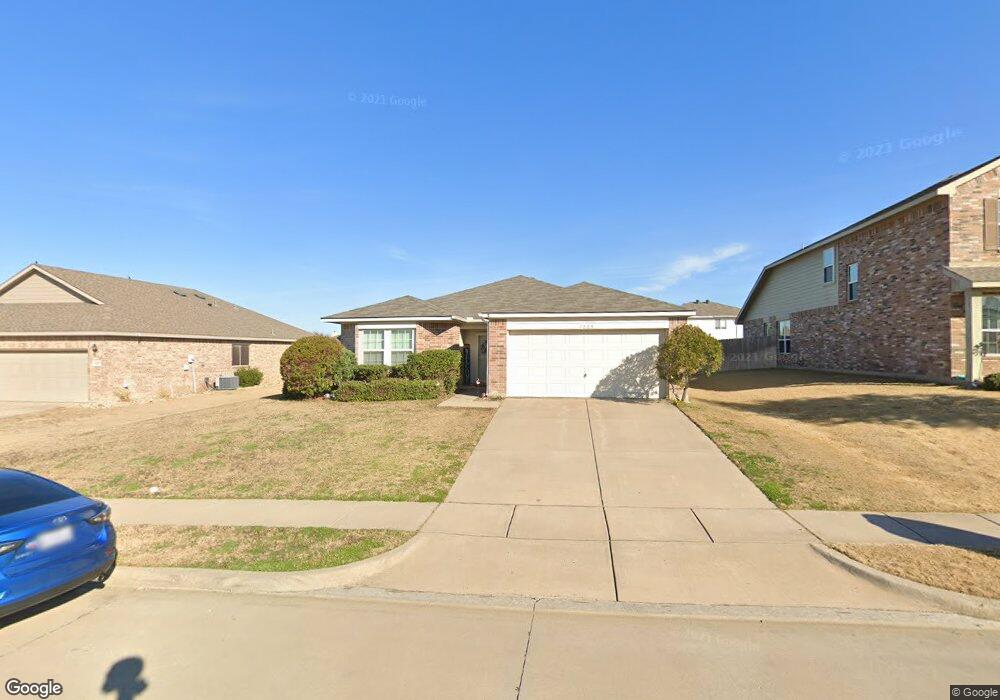
This home is located at 1229 Eagles Nest Trail, Krum, TX 76249 and is currently estimated at $288,405, approximately $180 per square foot. 1229 Eagles Nest Trail is a home located in Denton County with nearby schools including Krum Early Education Center, Blanche Dodd Intermediate School, and Krum Middle School.
Ownership History
Date
Name
Owned For
Owner Type
Purchase Details
Closed on
Sep 6, 2019
Sold by
Cardinal Financial Company Lp
Bought by
Black Thomas E
Current Estimated Value
Home Financials for this Owner
Home Financials are based on the most recent Mortgage that was taken out on this home.
Original Mortgage
$160,000
Outstanding Balance
$140,434
Interest Rate
3.7%
Mortgage Type
Stand Alone First
Estimated Equity
$147,971
Purchase Details
Closed on
Jan 22, 2010
Sold by
Senseman Wilbur J
Bought by
The Wilbur J Senseman Marital Trust
Purchase Details
Closed on
May 9, 2008
Sold by
Rh Of Texas Lp
Bought by
Senseman Wilbur James
Home Financials for this Owner
Home Financials are based on the most recent Mortgage that was taken out on this home.
Original Mortgage
$112,041
Interest Rate
5.86%
Mortgage Type
Purchase Money Mortgage
Create a Home Valuation Report for This Property
The Home Valuation Report is an in-depth analysis detailing your home's value as well as a comparison with similar homes in the area
Home Values in the Area
Average Home Value in this Area
Purchase History
| Date | Buyer | Sale Price | Title Company |
|---|---|---|---|
| Black Thomas E | -- | None Available | |
| The Wilbur J Senseman Marital Trust | -- | None Available | |
| Senseman Wilbur James | -- | None Available |
Source: Public Records
Mortgage History
| Date | Status | Borrower | Loan Amount |
|---|---|---|---|
| Open | Black Thomas E | $160,000 | |
| Previous Owner | Senseman Wilbur James | $112,041 |
Source: Public Records
Tax History Compared to Growth
Tax History
| Year | Tax Paid | Tax Assessment Tax Assessment Total Assessment is a certain percentage of the fair market value that is determined by local assessors to be the total taxable value of land and additions on the property. | Land | Improvement |
|---|---|---|---|---|
| 2025 | $4,394 | $276,000 | $67,860 | $208,140 |
| 2024 | $5,633 | $279,510 | $0 | $0 |
| 2023 | $3,889 | $254,100 | $65,725 | $259,275 |
| 2022 | $5,299 | $231,000 | $67,860 | $172,140 |
| 2021 | $4,657 | $210,000 | $49,010 | $160,990 |
| 2020 | $4,573 | $201,920 | $40,716 | $161,204 |
| 2019 | $4,891 | $202,703 | $40,716 | $163,137 |
| 2018 | $4,469 | $184,275 | $40,716 | $143,559 |
| 2017 | $4,227 | $173,520 | $40,716 | $132,804 |
| 2016 | $3,867 | $158,737 | $24,882 | $137,990 |
| 2015 | $2,421 | $144,306 | $24,882 | $119,424 |
| 2014 | $2,421 | $132,178 | $24,882 | $107,296 |
| 2013 | -- | $130,368 | $24,882 | $105,486 |
Source: Public Records
Map
Nearby Homes
- 205 Broken Arrow
- 1304 Dakota Trail
- 1404 Wenatchee Dr
- TBD E Mccart St
- 905 Clearview St
- 0 Farm To Market Road 1173
- 1604 Withers Way
- 334 Saddlebrook Dr
- 2309 Hillview Dr
- 1620 Kawati Way
- 1623 Withers Way
- 101 Thoroughbred Dr
- 1627 Kawati Way
- 3454 Eloise Ln
- 328 Broken Bow
- 8 S Sharon Dr
- TBD Masch Branch Rd
- 3537 Camden Creek Rd
- 4574 Masch Branch Rd
- 7272 Christina Ct
- 1227 Eagles Nest Trail
- 1231 Eagles Nest Trail
- 1228 Aztec Trail
- 1225 Eagles Nest Trail
- 1233 Eagles Nest Trail
- 1230 Aztec Trail
- 1226 Aztec Trail
- 1228 Eagles Nest Trail
- 1232 Aztec Trail
- 1226 Eagles Nest Trail
- 1230 Eagles Nest Trail
- 1224 Aztec Trail
- 1223 Eagles Nest Trail
- 1235 Eagles Nest Trail
- 1224 Eagles Nest Trail
- 1232 Eagles Nest Trail
- 1234 Aztec Trail
- 1222 Aztec Trail
- 1222 Eagles Nest Trail
- 1221 Eagles Nest Trail