Estimated Value: $629,000 - $834,000
5
Beds
3
Baths
2,125
Sq Ft
$330/Sq Ft
Est. Value
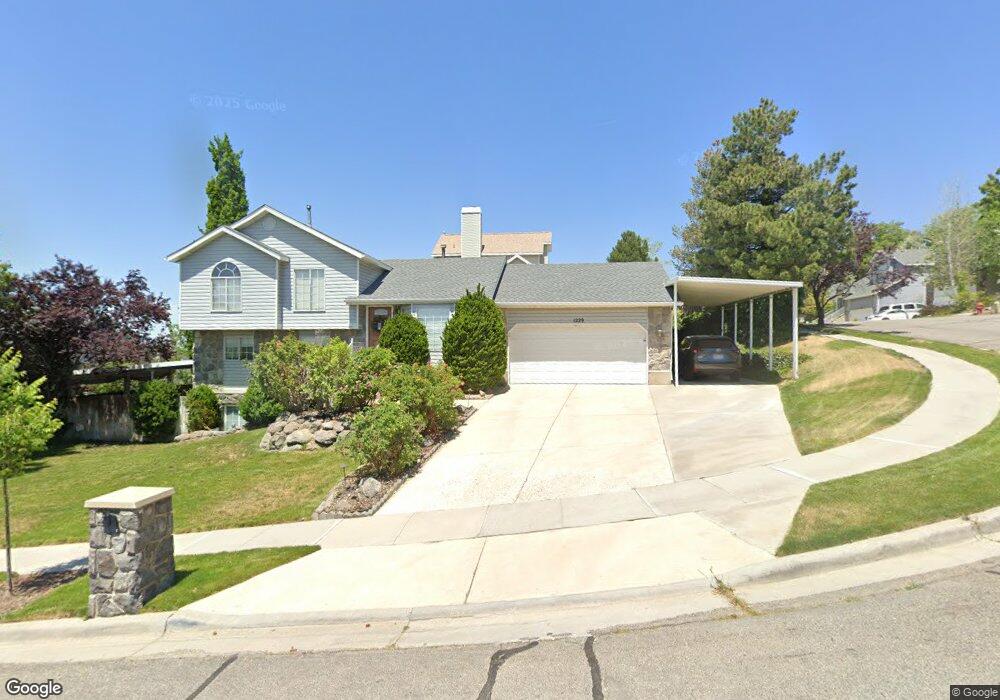
About This Home
This home is located at 1229 Geode Way, Sandy, UT 84094 and is currently estimated at $701,553, approximately $330 per square foot. 1229 Geode Way is a home located in Salt Lake County with nearby schools including Eastmont Middle School, Jordan High, and Blessed Sacrament Catholic School.
Ownership History
Date
Name
Owned For
Owner Type
Purchase Details
Closed on
Aug 10, 2020
Sold by
Gl Sherwood Llc
Bought by
Row Austin
Current Estimated Value
Home Financials for this Owner
Home Financials are based on the most recent Mortgage that was taken out on this home.
Original Mortgage
$469,300
Outstanding Balance
$413,350
Interest Rate
3.1%
Mortgage Type
New Conventional
Estimated Equity
$288,203
Purchase Details
Closed on
Apr 17, 2012
Sold by
Anderson Kenton S
Bought by
Gl Sherwood Llc
Purchase Details
Closed on
Sep 14, 1998
Sold by
Vankomen John J and Vankomen Michelle
Bought by
Anderson Kenton S
Home Financials for this Owner
Home Financials are based on the most recent Mortgage that was taken out on this home.
Original Mortgage
$191,343
Interest Rate
6.92%
Purchase Details
Closed on
May 15, 1995
Sold by
Vankomen John J and Utter Michelle
Bought by
Vankomen John J and Vankomen Michelle
Home Financials for this Owner
Home Financials are based on the most recent Mortgage that was taken out on this home.
Original Mortgage
$19,700
Interest Rate
8.47%
Create a Home Valuation Report for This Property
The Home Valuation Report is an in-depth analysis detailing your home's value as well as a comparison with similar homes in the area
Home Values in the Area
Average Home Value in this Area
Purchase History
| Date | Buyer | Sale Price | Title Company |
|---|---|---|---|
| Row Austin | -- | Integrated Title Ins Svcs | |
| Gl Sherwood Llc | $236,634 | None Available | |
| Anderson Kenton S | -- | -- | |
| Vankomen John J | -- | -- |
Source: Public Records
Mortgage History
| Date | Status | Borrower | Loan Amount |
|---|---|---|---|
| Open | Row Austin | $469,300 | |
| Previous Owner | Anderson Kenton S | $191,343 | |
| Previous Owner | Vankomen John J | $19,700 |
Source: Public Records
Tax History
| Year | Tax Paid | Tax Assessment Tax Assessment Total Assessment is a certain percentage of the fair market value that is determined by local assessors to be the total taxable value of land and additions on the property. | Land | Improvement |
|---|---|---|---|---|
| 2025 | $3,225 | $644,700 | $146,200 | $498,500 |
| 2024 | $3,168 | $618,400 | $135,300 | $483,100 |
| 2023 | $3,168 | $597,200 | $128,600 | $468,600 |
| 2022 | $3,316 | $610,700 | $126,100 | $484,600 |
| 2021 | $2,920 | $458,400 | $116,400 | $342,000 |
| 2020 | $2,662 | $394,200 | $95,100 | $299,100 |
| 2019 | $2,652 | $364,100 | $95,100 | $269,000 |
Source: Public Records
Map
Nearby Homes
- 9976 Tamara St E
- 9968 S Blossom Dr
- 9633 S 1210 E
- 1469 Winterwood Cir
- 1123 E Sego Lily Dr
- 1563 E Tameron Dr
- 9587 S 1040 E
- 1584 Petunia Way
- 10172 Snow Iris Way
- 1105 E Webster Dr
- 9971 Pinehurst Dr
- 9828 Pinehurst Dr
- 1650 E Budding Dr
- 9979 S Albury Rd
- 1420 E Firelight Way
- 941 E Carnation Dr
- 10240 Locksley Rd
- 10158 Buttercup Dr
- 1492 E Sandy Hills Dr
- 954 E Carnation Dr
- 1229 E Geode Way
- 9854 S Tiger Eye Dr
- 9854 Tiger Eye Dr
- 9865 S Geode Cir
- 9865 Geode Cir
- 9879 S Tiger Eye Dr
- 9879 Tiger Eye Dr
- 9853 Geode Cir
- 9853 S Geode Cir
- 1226 Geode Way
- 9869 Tiger Eye Dr
- 9869 S Tiger Eye Dr
- 1234 Geode Way
- 9857 Tiger Eye Dr
- 9842 Tiger Eye Dr
- 1216 Geode Way
- 1216 E Geode Way
- 9845 Geode Cir
- 9845 S Geode Cir
- 9847 Tiger Eye Dr
Your Personal Tour Guide
Ask me questions while you tour the home.