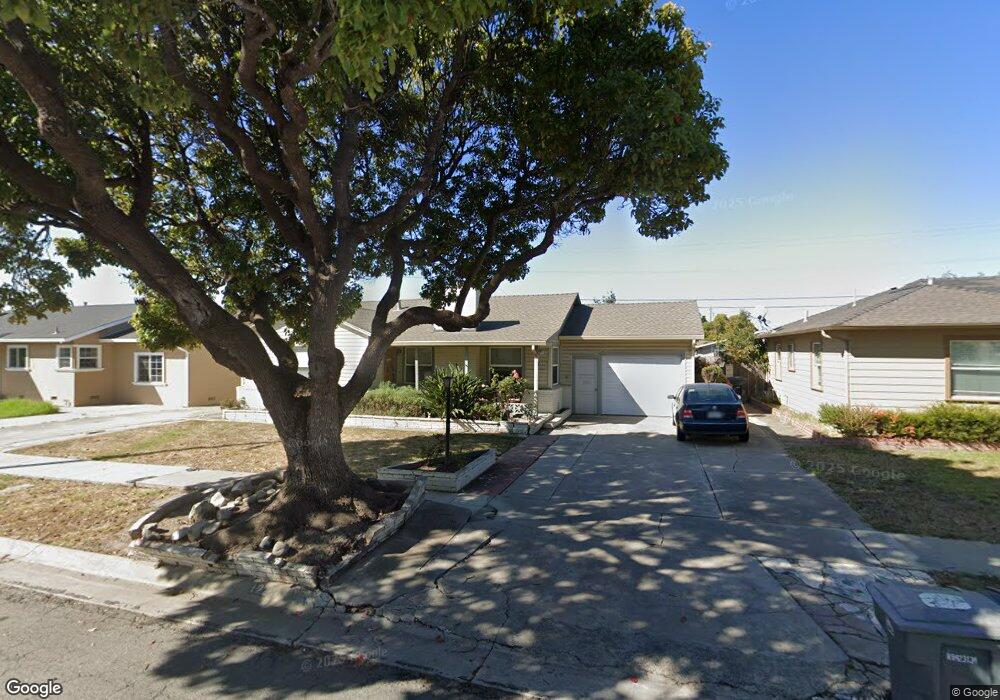
1229 Monroe St Salinas, CA 93906
Northridge NeighborhoodEstimated Value: $556,000 - $693,000
3
Beds
1
Bath
1,055
Sq Ft
$597/Sq Ft
Est. Value
About This Home
This home is located at 1229 Monroe St, Salinas, CA 93906 and is currently estimated at $630,133, approximately $597 per square foot. 1229 Monroe St is a home located in Monterey County with nearby schools including Henry F. Kammann Elementary School, Boronda Meadows Elementary School, and Harden Middle School.
Ownership History
Date
Name
Owned For
Owner Type
Purchase Details
Closed on
Apr 18, 2000
Sold by
Rabesa Frances
Bought by
Laplace Brian A and Laplace Elise C
Current Estimated Value
Home Financials for this Owner
Home Financials are based on the most recent Mortgage that was taken out on this home.
Original Mortgage
$198,000
Outstanding Balance
$67,883
Interest Rate
8.24%
Estimated Equity
$562,250
Create a Home Valuation Report for This Property
The Home Valuation Report is an in-depth analysis detailing your home's value as well as a comparison with similar homes in the area
Home Values in the Area
Average Home Value in this Area
Purchase History
We collect this data history from publicly available records. To have your information removed, we recommend requesting removal directly through your county’s website.
| Date | Buyer | Sale Price | Title Company |
|---|---|---|---|
| Laplace Brian A | $198,000 | Old Republic Title Company |
Source: Public Records
Mortgage History
We collect this data history from publicly available records. To have your information removed, we recommend requesting removal directly through your county’s website.
| Date | Status | Borrower | Loan Amount |
|---|---|---|---|
| Open | Laplace Brian A | $198,000 |
Source: Public Records
Tax History
| Year | Tax Paid | Tax Assessment Tax Assessment Total Assessment is a certain percentage of the fair market value that is determined by local assessors to be the total taxable value of land and additions on the property. | Land | Improvement |
|---|---|---|---|---|
| 2025 | $3,435 | $304,316 | $122,953 | $181,363 |
| 2024 | $3,435 | $298,350 | $120,543 | $177,807 |
| 2023 | $3,318 | $292,501 | $118,180 | $174,321 |
| 2022 | $3,191 | $286,766 | $115,863 | $170,903 |
| 2021 | $3,064 | $281,144 | $113,592 | $167,552 |
| 2020 | $2,979 | $278,262 | $112,428 | $165,834 |
| 2019 | $2,956 | $272,807 | $110,224 | $162,583 |
| 2018 | $2,915 | $267,459 | $108,063 | $159,396 |
| 2017 | $2,916 | $262,216 | $105,945 | $156,271 |
| 2016 | $2,917 | $257,075 | $103,868 | $153,207 |
| 2015 | $2,941 | $253,214 | $102,308 | $150,906 |
| 2014 | $2,281 | $207,000 | $84,000 | $123,000 |
Source: Public Records
Map
Nearby Homes
- 1205 Monroe St
- 1350 Cherokee Dr
- 505 Polk Cir
- 344 Pueblo Dr
- 1515 Aragon Cir
- 410 Noice Dr
- 1506 Barcelona Cir
- 730 N Main St
- 246 Terra Dr
- 1619 Cherokee Dr
- 1630 Seville St
- 1627 Cherokee Dr
- 1664 Seville St
- 1875 Cherokee Dr Unit 4
- 1715 Cherokee Dr
- 548 Stockton St
- 1797 Cherokee Dr Unit 4
- 1791 Cherokee Dr Unit 4
- 336 Rainier Dr
- 1825 Cherokee Dr Unit 2
Your Personal Tour Guide
Ask me questions while you tour the home.