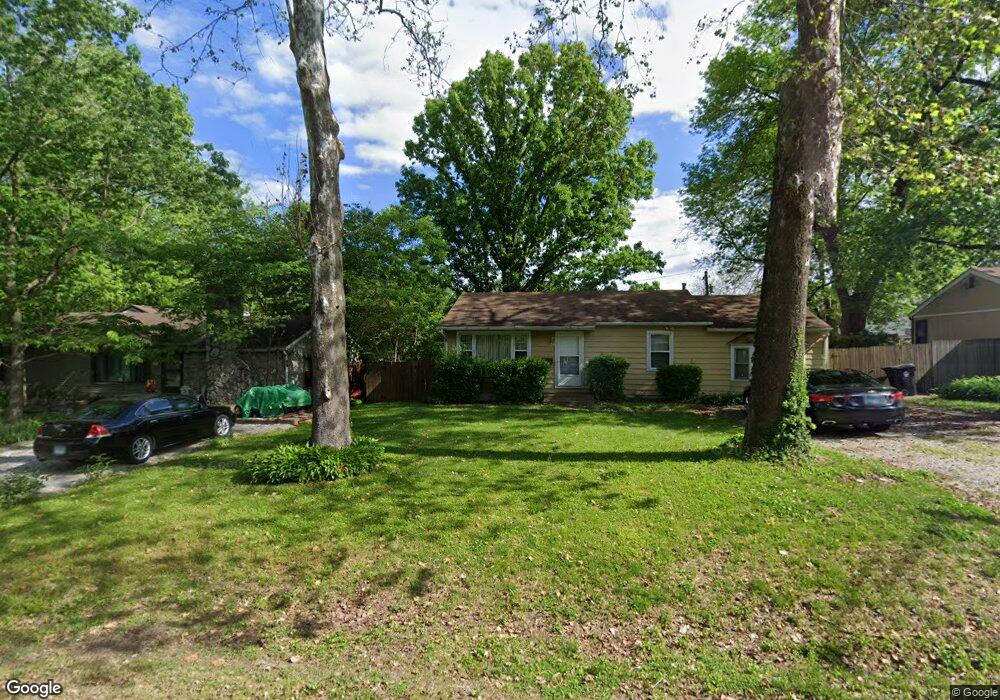
1229 N 17th St Unit 30 Belleville, IL 62226
Estimated Value: $99,000 - $129,507
2
Beds
2
Baths
1,280
Sq Ft
$90/Sq Ft
Est. Value
About This Home
This home is located at 1229 N 17th St Unit 30, Belleville, IL 62226 and is currently estimated at $114,627, approximately $89 per square foot. 1229 N 17th St Unit 30 is a home located in St. Clair County with nearby schools including Union Elementary School, West Jr High School, and Governor French Academy.
Ownership History
Date
Name
Owned For
Owner Type
Purchase Details
Closed on
Apr 28, 2021
Sold by
Stuck Jamie D
Bought by
Stuck Gerald
Current Estimated Value
Purchase Details
Closed on
Sep 5, 2013
Sold by
Stuck Gerald L
Bought by
Stuck Gerald L and Stuck Jamie D
Purchase Details
Closed on
Oct 16, 2012
Sold by
Selene Rmof Ii Reo Acquisition Ii Llc
Bought by
Stuck Charles E and Stuck Gerald L
Purchase Details
Closed on
Aug 24, 2011
Sold by
Reed Christopher
Bought by
Aurora Loan Services Llc
Purchase Details
Closed on
Apr 22, 2002
Sold by
Rider Rodney T and Mcmillin Margaret J
Bought by
Reed Christopher
Home Financials for this Owner
Home Financials are based on the most recent Mortgage that was taken out on this home.
Original Mortgage
$67,000
Interest Rate
8.59%
Mortgage Type
Purchase Money Mortgage
Create a Home Valuation Report for This Property
The Home Valuation Report is an in-depth analysis detailing your home's value as well as a comparison with similar homes in the area
Home Values in the Area
Average Home Value in this Area
Purchase History
| Date | Buyer | Sale Price | Title Company |
|---|---|---|---|
| Stuck Gerald | -- | None Available | |
| Stuck Gerald L | -- | None Available | |
| Stuck Charles E | $24,599 | First American | |
| Aurora Loan Services Llc | -- | None Available | |
| Reed Christopher | $67,000 | -- |
Source: Public Records
Mortgage History
| Date | Status | Borrower | Loan Amount |
|---|---|---|---|
| Previous Owner | Reed Christopher | $67,000 |
Source: Public Records
Tax History Compared to Growth
Tax History
| Year | Tax Paid | Tax Assessment Tax Assessment Total Assessment is a certain percentage of the fair market value that is determined by local assessors to be the total taxable value of land and additions on the property. | Land | Improvement |
|---|---|---|---|---|
| 2024 | $1,746 | $25,857 | $784 | $25,073 |
| 2023 | $1,582 | $22,853 | $1,026 | $21,827 |
| 2022 | $1,395 | $20,574 | $924 | $19,650 |
| 2021 | $1,298 | $19,020 | $854 | $18,166 |
| 2020 | $1,236 | $17,987 | $808 | $17,179 |
| 2019 | $1,332 | $18,860 | $850 | $18,010 |
| 2018 | $1,289 | $18,453 | $832 | $17,621 |
| 2017 | $1,281 | $18,323 | $826 | $17,497 |
| 2016 | $1,259 | $17,933 | $808 | $17,125 |
| 2014 | $752 | $8,134 | $1,703 | $6,431 |
| 2013 | $1,850 | $8,250 | $1,727 | $6,523 |
Source: Public Records
Map
Nearby Homes
- 1229 N 17th St Unit 5
- 1229 N 17th St Unit 23
- 1229 N 17th St Unit 33
- 1229 N 17th St Unit 23
- 1229 N 17th St Unit 15
- 1229 N 17th St Unit 36
- 1229 N 17th St Unit 25
- 1229 N 17th St
- 1229 N 17th St Unit 28
- 1229 N 17th St
- 1229 N 17th St Unit 32
- 1229 N 17th St Unit 34
- 1229 N 17th St Unit 4
- 1229 N 17th St Unit 19
- 1229 N 17th St Unit 12
- 1229 N 17th St Unit 10
- 1229 N 17th St
- 1229 N 17th St
- 1229 N 17th St
- 1229 N 17th St