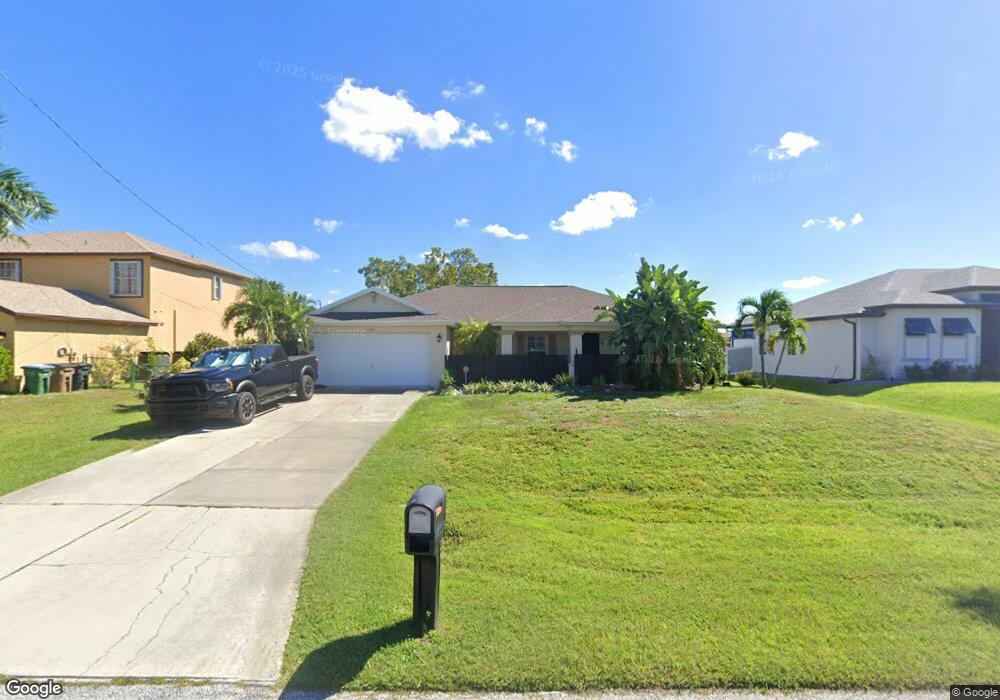
1229 NW 35th Place Cape Coral, FL 33993
Burnt Store NeighborhoodEstimated Value: $297,500 - $485,000
3
Beds
2
Baths
1,777
Sq Ft
$219/Sq Ft
Est. Value
About This Home
This home is located at 1229 NW 35th Place, Cape Coral, FL 33993 and is currently estimated at $388,625, approximately $218 per square foot. 1229 NW 35th Place is a home located in Lee County with nearby schools including Caloosa Elementary School, Dr. Carrie D. Robinson Littleton Elementary School, and Tropic Isles Elementary School.
Ownership History
Date
Name
Owned For
Owner Type
Purchase Details
Closed on
Apr 15, 2009
Sold by
Peterson Kathleen M
Bought by
Corona Property Holdings Llc
Current Estimated Value
Purchase Details
Closed on
Feb 4, 2009
Sold by
Bank Of America Na
Bought by
Peterson Kathleen M
Purchase Details
Closed on
Mar 5, 2008
Sold by
Dunn Trent D and Dunn Leesa R
Bought by
Bank Of America Na
Purchase Details
Closed on
Oct 12, 2004
Sold by
First Home Builders Of Florida
Bought by
Dunn Trent D and Dunn Leesa R
Home Financials for this Owner
Home Financials are based on the most recent Mortgage that was taken out on this home.
Original Mortgage
$124,300
Interest Rate
4.62%
Mortgage Type
Unknown
Purchase Details
Closed on
Sep 10, 2003
Sold by
Merkel Roy H and Merkel Lorraine
Bought by
1St Home Bldr Fl
Create a Home Valuation Report for This Property
The Home Valuation Report is an in-depth analysis detailing your home's value as well as a comparison with similar homes in the area
Home Values in the Area
Average Home Value in this Area
Purchase History
| Date | Buyer | Sale Price | Title Company |
|---|---|---|---|
| Corona Property Holdings Llc | $98,000 | Southwest Community Title In | |
| Peterson Kathleen M | $71,100 | Watson Title Insurance Agenc | |
| Bank Of America Na | $232,600 | Attorney | |
| Dunn Trent D | $155,500 | First Home Title Inc | |
| 1St Home Bldr Fl | $12,000 | -- |
Source: Public Records
Mortgage History
| Date | Status | Borrower | Loan Amount |
|---|---|---|---|
| Previous Owner | Dunn Trent D | $124,300 |
Source: Public Records
Tax History Compared to Growth
Tax History
| Year | Tax Paid | Tax Assessment Tax Assessment Total Assessment is a certain percentage of the fair market value that is determined by local assessors to be the total taxable value of land and additions on the property. | Land | Improvement |
|---|---|---|---|---|
| 2025 | $4,610 | $165,852 | $44,413 | $121,140 |
| 2024 | $4,329 | $219,970 | -- | -- |
| 2023 | $4,329 | $199,973 | $0 | $0 |
| 2022 | $3,861 | $181,794 | $0 | $0 |
| 2021 | $3,446 | $165,267 | $13,500 | $151,767 |
| 2020 | $3,347 | $154,242 | $12,000 | $142,242 |
| 2019 | $3,072 | $140,517 | $13,000 | $127,517 |
| 2018 | $3,123 | $142,119 | $13,000 | $129,119 |
| 2017 | $3,017 | $142,113 | $10,000 | $132,113 |
| 2016 | $2,770 | $127,134 | $10,000 | $117,134 |
| 2015 | $2,556 | $111,306 | $10,000 | $101,306 |
| 2014 | -- | $103,407 | $8,836 | $94,571 |
| 2013 | -- | $87,912 | $5,600 | $82,312 |
Source: Public Records
Map
Nearby Homes
- 1213 NW 35th Ave
- 1207 NW 35th Ave
- 1235 NW 35th Ave
- 1237 NW 36th Ave
- 1216 NW 36th Ave
- 1206 NW 36th Ave
- 1234 NW 36th Ave
- 1224 NW 34th Ave
- 1228 NW 34th Ave
- 1248 NW 35th Ave
- 1247 NW 35th Ave
- 3410 Yucatan Pkwy
- 1255 NW 35th Ave
- 3523 NW 14th St
- 1046 NW 34th Ave
- 1032 NW 35th Ave
- 1054 NW 33rd Place
- 803 NW 33rd Place
- 3518 NW 14th Terrace
- 1025 NW 35th Place
- 1225 NW 35th Place
- 1233 NW 35th Place
- 1228 NW 35th Ave
- 1232 NW 35th Ave
- 1221 NW 35th Place
- 1237 NW 35th Place
- 1228 NW 35th Place
- 1224 NW 35th Place
- 1232 NW 35th Place
- 1220 NW 35th Ave
- 1236 NW 35th Ave Unit 33
- 1220 NW 35th Place
- 1230 NW 35th Place Unit 60
- 1236 NW 35th Place
- 1240 NW 35th Ave
- 1240 NW 35th Place
- 1231 NW 36th Ave
- 1231 NW 35th Ave
- 1213 NW 35th Place Unit 7
- 1213 NW 35th Place