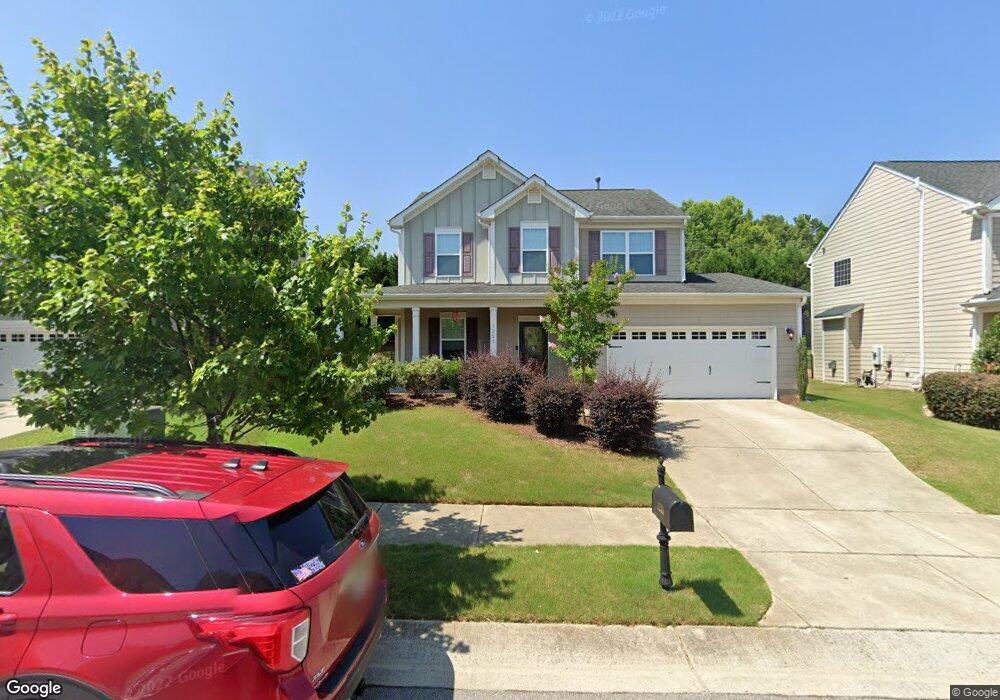
1229 Old Bramble Ln Fuquay Varina, NC 27526
Estimated Value: $409,000 - $456,000
3
Beds
3
Baths
1,957
Sq Ft
$223/Sq Ft
Est. Value
About This Home
This home is located at 1229 Old Bramble Ln, Fuquay Varina, NC 27526 and is currently estimated at $435,988, approximately $222 per square foot. 1229 Old Bramble Ln is a home located in Wake County with nearby schools including Carolina Charter Academy.
Ownership History
Date
Name
Owned For
Owner Type
Purchase Details
Closed on
May 21, 2014
Sold by
B M C H North Carolina L L C
Bought by
Johnson Andrew Brent and Johnson Elizabeth Harmon
Current Estimated Value
Home Financials for this Owner
Home Financials are based on the most recent Mortgage that was taken out on this home.
Original Mortgage
$205,190
Interest Rate
2.87%
Mortgage Type
Adjustable Rate Mortgage/ARM
Purchase Details
Closed on
Dec 16, 2011
Sold by
Citizens Homes Inc
Bought by
Ebron Rebecca G and Ebron Troy F
Home Financials for this Owner
Home Financials are based on the most recent Mortgage that was taken out on this home.
Original Mortgage
$204,620
Interest Rate
4.06%
Mortgage Type
New Conventional
Purchase Details
Closed on
Sep 8, 2010
Sold by
Lakestone Partners Llc
Bought by
Citizens Homes Inc
Create a Home Valuation Report for This Property
The Home Valuation Report is an in-depth analysis detailing your home's value as well as a comparison with similar homes in the area
Home Values in the Area
Average Home Value in this Area
Purchase History
| Date | Buyer | Sale Price | Title Company |
|---|---|---|---|
| Johnson Andrew Brent | $216,000 | None Available | |
| Ebron Rebecca G | $227,500 | None Available | |
| Citizens Homes Inc | $315,000 | None Available |
Source: Public Records
Mortgage History
| Date | Status | Borrower | Loan Amount |
|---|---|---|---|
| Previous Owner | Johnson Andrew Brent | $205,190 | |
| Previous Owner | Ebron Rebecca G | $204,620 |
Source: Public Records
Tax History Compared to Growth
Tax History
| Year | Tax Paid | Tax Assessment Tax Assessment Total Assessment is a certain percentage of the fair market value that is determined by local assessors to be the total taxable value of land and additions on the property. | Land | Improvement |
|---|---|---|---|---|
| 2025 | $3,742 | $425,284 | $95,000 | $330,284 |
| 2024 | $3,726 | $425,284 | $95,000 | $330,284 |
| 2023 | $2,942 | $262,781 | $42,000 | $220,781 |
| 2022 | $2,765 | $262,781 | $42,000 | $220,781 |
| 2021 | $2,635 | $262,781 | $42,000 | $220,781 |
| 2020 | $2,635 | $262,781 | $42,000 | $220,781 |
| 2019 | $2,554 | $219,757 | $42,000 | $177,757 |
| 2018 | $2,409 | $219,757 | $42,000 | $177,757 |
| 2017 | $2,322 | $219,757 | $42,000 | $177,757 |
| 2016 | $2,290 | $219,757 | $42,000 | $177,757 |
| 2015 | $2,214 | $219,465 | $50,000 | $169,465 |
| 2014 | -- | $219,465 | $50,000 | $169,465 |
Source: Public Records
Map
Nearby Homes
- 410 Stranraer Ct
- 409 Kilcornac Ct
- 526 Cardena School Rd
- 1643 Southcross St
- 1904 Fishamble St
- 1909 Fishamble St
- 1909 Fishamble St Unit 16
- 1921 Fishamble St
- 1633 Lakestone Village Ln
- 1912 Fishamble St Unit 20
- Citrine Plan at Lakestone Townhomes
- Sunstone Plan at Lakestone Townhomes
- 1977 Enniscorthy St
- 1757 Whitbrook Ct
- 804 Kensley Grove Ln Unit 9
- 806 Kensley Grove Ln
- 806 Kensley Grove Ln Unit 8
- 817 Kensley Grove Ln Unit 16
- 934 Kensley Grove Ln
- 934 Kensley Grove Ln Unit 60
- 1301 Old Bramble Ln
- 1225 Old Bramble Ln
- 1305 Old Bramble Ln
- 1221 Old Bramble Ln
- 1228 Old Bramble Ln
- 1309 Old Bramble Ln
- 1224 Old Bramble Ln
- 1217 Old Bramble Ln
- 1304 Old Bramble Ln
- 411 Banagher Ln
- 411 Stranraer Ct
- 411 Stranraer Ct Unit Lt160
- 1313 Old Bramble Ln
- 414 Banagher Ln
- 1308 Old Bramble Ln
- 1213 Old Bramble Ln
- 1213 Old Bramble Ln Unit 198
- 418 Silky Willow Dr
- 415 Stranraer Ct
- 417 Banagher Ln