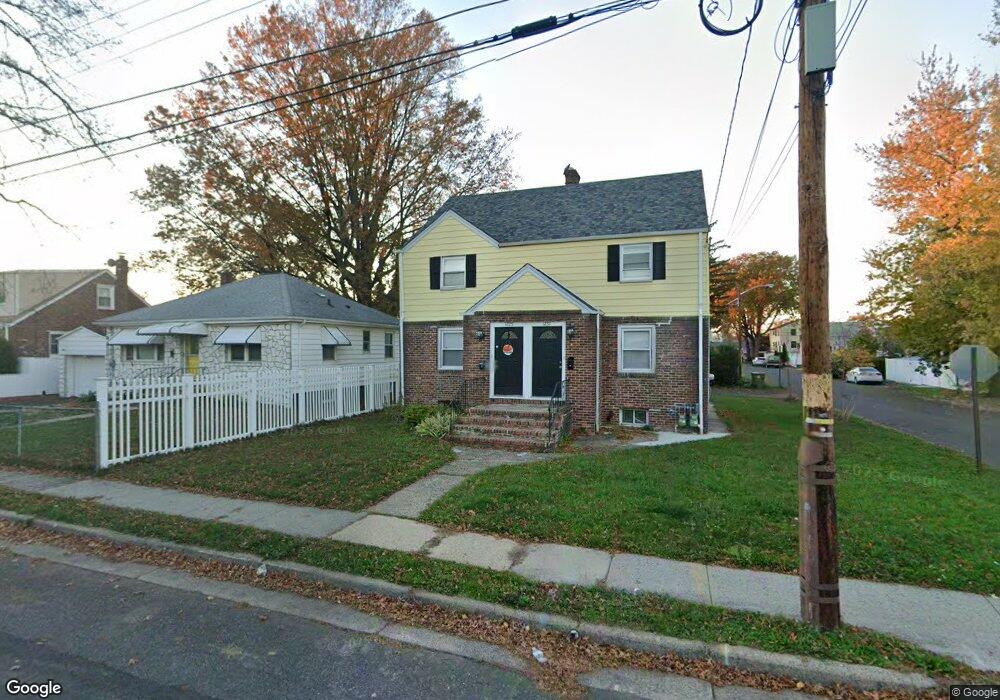
1229 Passaic Ave Unit 1231 Linden, NJ 07036
Estimated Value: $332,000 - $525,000
4
Beds
2
Baths
920
Sq Ft
$484/Sq Ft
Est. Value
About This Home
This home is located at 1229 Passaic Ave Unit 1231, Linden, NJ 07036 and is currently estimated at $445,114, approximately $483 per square foot. 1229 Passaic Ave Unit 1231 is a home located in Union County with nearby schools including Dr Charles C Polk School, Grace Wilday Junior High School, and Leonard V. Moore Middle School.
Ownership History
Date
Name
Owned For
Owner Type
Purchase Details
Closed on
Apr 9, 2021
Sold by
Rodani Homes Llc
Bought by
Rodani Rentals Llc
Current Estimated Value
Home Financials for this Owner
Home Financials are based on the most recent Mortgage that was taken out on this home.
Original Mortgage
$388,218
Interest Rate
2.9%
Mortgage Type
Stand Alone Second
Purchase Details
Closed on
Jul 29, 2020
Sold by
Beauchamp Janice M and Chamberlin Rafeal
Bought by
Rodani Homes Llc
Home Financials for this Owner
Home Financials are based on the most recent Mortgage that was taken out on this home.
Original Mortgage
$260,000
Interest Rate
2.7%
Mortgage Type
Construction
Purchase Details
Closed on
May 20, 1992
Bought by
Beauchamp Janice M
Create a Home Valuation Report for This Property
The Home Valuation Report is an in-depth analysis detailing your home's value as well as a comparison with similar homes in the area
Home Values in the Area
Average Home Value in this Area
Purchase History
| Date | Buyer | Sale Price | Title Company |
|---|---|---|---|
| Rodani Rentals Llc | -- | Vantage Point Title Inc | |
| Rodani Rentals Llc | -- | Vantage Point Title | |
| Rodani Homes Llc | $200,000 | Clear Skies Title Agency | |
| Beauchamp Janice M | -- | -- |
Source: Public Records
Mortgage History
| Date | Status | Borrower | Loan Amount |
|---|---|---|---|
| Previous Owner | Rodani Rentals Llc | $388,218 | |
| Previous Owner | Rodani Homes Llc | $260,000 |
Source: Public Records
Tax History Compared to Growth
Tax History
| Year | Tax Paid | Tax Assessment Tax Assessment Total Assessment is a certain percentage of the fair market value that is determined by local assessors to be the total taxable value of land and additions on the property. | Land | Improvement |
|---|---|---|---|---|
| 2025 | $9,866 | $140,300 | $48,000 | $92,300 |
| 2024 | $9,650 | $140,300 | $48,000 | $92,300 |
| 2023 | $9,650 | $140,300 | $48,000 | $92,300 |
| 2022 | $9,700 | $140,300 | $48,000 | $92,300 |
| 2021 | $9,749 | $140,300 | $48,000 | $92,300 |
| 2020 | $9,698 | $140,300 | $48,000 | $92,300 |
| 2019 | $9,665 | $140,300 | $48,000 | $92,300 |
| 2018 | $9,662 | $140,300 | $48,000 | $92,300 |
| 2017 | $9,453 | $140,300 | $48,000 | $92,300 |
| 2016 | $9,156 | $140,300 | $48,000 | $92,300 |
| 2015 | $8,807 | $140,300 | $48,000 | $92,300 |
| 2014 | -- | $140,300 | $48,000 | $92,300 |
Source: Public Records
Map
Nearby Homes
- 1005 Nora Dr
- 1116 Dill Ave
- 1105 Dill Ave
- 1107 Drake Ave
- 1215 Bergen Ave
- 807 Carnegie St
- 217 Chandler Ave
- 13 Carolyn Terrace Unit A
- 1121 Frank St
- 31 Carolynn Rd
- 1115 Frank St
- 119 Grant St
- 930 Drake Ave
- 812 Lincoln St
- 423 Bernard Ave
- 419 Bernard Ave
- 916 Harrison Ave
- 1120 Morris St
- 1112 Morris St
- 1204 Warren St
- 1225 Passaic Ave
- 1301 Passaic Ave
- 1228 E Henry St
- 1219 Passaic Ave
- 1224 E Henry St
- 1224 E Henry St Unit 1
- 1300 E Henry St
- 1220 E Henry St
- 1217 Passaic Ave
- 1228 Passaic Ave
- 1305 Passaic Ave
- 1224 Passaic Ave
- 1304 E Henry St
- 1220 Passaic Ave
- 1214 E Henry St
- 1213 Passaic Ave
- 1216 Passaic Ave
- 1311 Passaic Ave
- 1310 E Henry St
- 1212 E Henry St