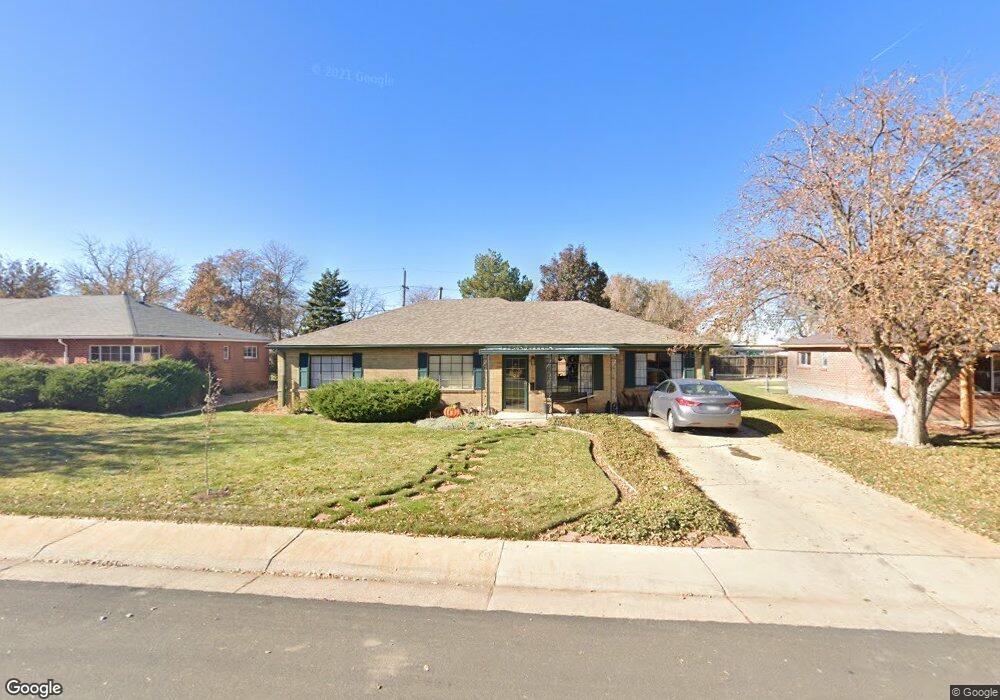
1229 Quari St Aurora, CO 80011
Hoffman Heights NeighborhoodEstimated Value: $404,610 - $430,000
3
Beds
2
Baths
1,621
Sq Ft
$256/Sq Ft
Est. Value
About This Home
This home is located at 1229 Quari St, Aurora, CO 80011 and is currently estimated at $414,653, approximately $255 per square foot. 1229 Quari St is a home located in Arapahoe County with nearby schools including Vaughn Elementary School, North Middle School Health Sciences & Technology, and Aurora Central High School.
Ownership History
Date
Name
Owned For
Owner Type
Purchase Details
Closed on
Aug 7, 2017
Sold by
Kitsmiller Jerry William and Kitsmiller Michal Dawn
Bought by
Kitsmiller Jerry William and Kitsmiller Michal Dawn
Current Estimated Value
Purchase Details
Closed on
Oct 1, 1985
Sold by
Conversion Arapco
Bought by
Conversion Arapco
Purchase Details
Closed on
Oct 1, 1982
Sold by
Conversion Arapco
Bought by
Conversion Arapco
Purchase Details
Closed on
Aug 1, 1979
Sold by
Conversion Arapco
Bought by
Conversion Arapco
Purchase Details
Closed on
Jul 4, 1776
Bought by
Conversion Arapco
Create a Home Valuation Report for This Property
The Home Valuation Report is an in-depth analysis detailing your home's value as well as a comparison with similar homes in the area
Home Values in the Area
Average Home Value in this Area
Purchase History
| Date | Buyer | Sale Price | Title Company |
|---|---|---|---|
| Kitsmiller Jerry William | -- | None Available | |
| Kitsmiller Jerry William | -- | None Available | |
| Conversion Arapco | -- | -- | |
| Conversion Arapco | -- | -- | |
| Conversion Arapco | -- | -- | |
| Conversion Arapco | -- | -- |
Source: Public Records
Tax History
| Year | Tax Paid | Tax Assessment Tax Assessment Total Assessment is a certain percentage of the fair market value that is determined by local assessors to be the total taxable value of land and additions on the property. | Land | Improvement |
|---|---|---|---|---|
| 2025 | $2,354 | $25,113 | -- | -- |
| 2024 | $2,284 | $24,569 | -- | -- |
| 2023 | $2,284 | $24,569 | $0 | $0 |
| 2022 | $2,173 | $21,643 | $0 | $0 |
| 2021 | $2,243 | $21,643 | $0 | $0 |
| 2020 | $2,158 | $20,721 | $0 | $0 |
| 2019 | $2,146 | $20,721 | $0 | $0 |
| 2018 | $1,806 | $17,078 | $0 | $0 |
| 2017 | $1,571 | $17,078 | $0 | $0 |
| 2016 | $1,149 | $12,227 | $0 | $0 |
| 2015 | $1,109 | $12,227 | $0 | $0 |
| 2014 | -- | $8,159 | $0 | $0 |
| 2013 | -- | $8,510 | $0 | $0 |
Source: Public Records
Map
Nearby Homes
Your Personal Tour Guide
Ask me questions while you tour the home.