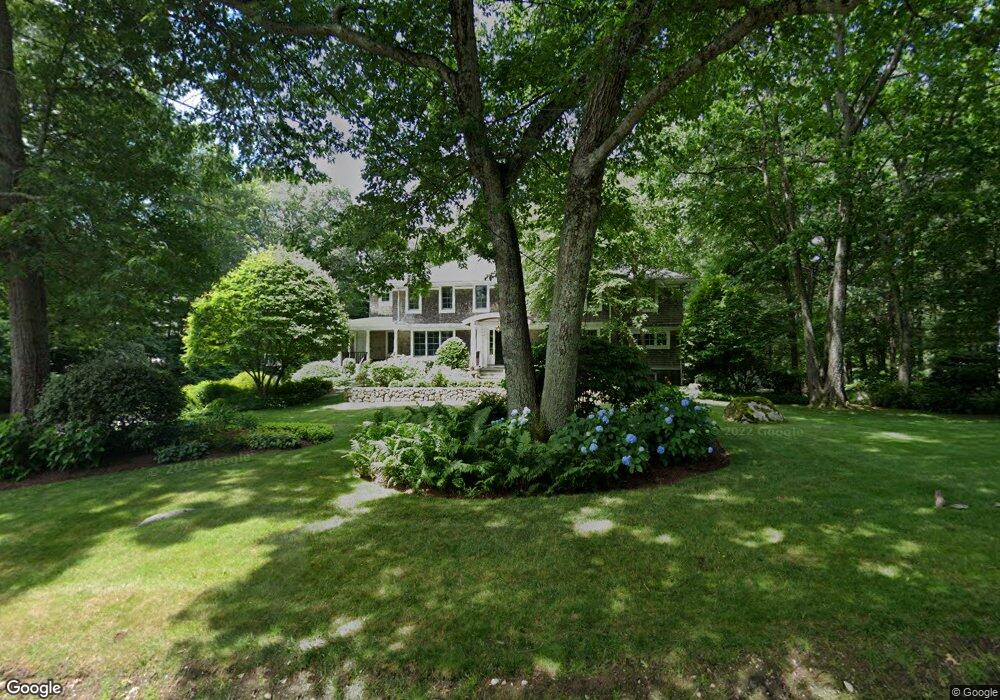
123 Beaver Rd Weston, MA 02493
Estimated Value: $3,077,123 - $4,299,000
5
Beds
4
Baths
3,818
Sq Ft
$984/Sq Ft
Est. Value
About This Home
This home is located at 123 Beaver Rd, Weston, MA 02493 and is currently estimated at $3,755,374, approximately $983 per square foot. 123 Beaver Rd is a home located in Middlesex County with nearby schools including Country Elementary School, Woodland Elementary School, and Weston Middle School.
Ownership History
Date
Name
Owned For
Owner Type
Purchase Details
Closed on
Jun 29, 2007
Sold by
Beaver Road Rt and Swift Nicola
Bought by
Stephens Alex P and Stephens Heather
Current Estimated Value
Purchase Details
Closed on
Jun 3, 1996
Sold by
Rose Janice R
Bought by
Swift Robert J and Swift Nicola
Home Financials for this Owner
Home Financials are based on the most recent Mortgage that was taken out on this home.
Original Mortgage
$400,000
Interest Rate
7.91%
Mortgage Type
Purchase Money Mortgage
Create a Home Valuation Report for This Property
The Home Valuation Report is an in-depth analysis detailing your home's value as well as a comparison with similar homes in the area
Home Values in the Area
Average Home Value in this Area
Purchase History
| Date | Buyer | Sale Price | Title Company |
|---|---|---|---|
| Stephens Alex P | $2,399,000 | -- | |
| Swift Robert J | $677,000 | -- |
Source: Public Records
Mortgage History
| Date | Status | Borrower | Loan Amount |
|---|---|---|---|
| Previous Owner | Swift Robert J | $400,000 |
Source: Public Records
Tax History Compared to Growth
Tax History
| Year | Tax Paid | Tax Assessment Tax Assessment Total Assessment is a certain percentage of the fair market value that is determined by local assessors to be the total taxable value of land and additions on the property. | Land | Improvement |
|---|---|---|---|---|
| 2025 | $33,369 | $3,006,200 | $962,300 | $2,043,900 |
| 2024 | $32,410 | $2,914,600 | $962,300 | $1,952,300 |
| 2023 | $31,839 | $2,689,100 | $962,300 | $1,726,800 |
| 2022 | $30,830 | $2,406,700 | $922,100 | $1,484,600 |
| 2021 | $29,163 | $2,246,800 | $874,700 | $1,372,100 |
| 2020 | $27,790 | $2,166,000 | $874,700 | $1,291,300 |
| 2019 | $27,140 | $2,155,700 | $874,700 | $1,281,000 |
| 2018 | $8,979 | $2,155,700 | $874,700 | $1,281,000 |
| 2017 | $26,929 | $2,171,700 | $874,700 | $1,297,000 |
| 2016 | $26,408 | $2,171,700 | $874,700 | $1,297,000 |
| 2015 | $25,899 | $2,109,000 | $833,300 | $1,275,700 |
Source: Public Records
Map
Nearby Homes
- 168 Beaver Rd
- 169 Hickory Rd
- 19 Northgate Rd
- 19 Louis Dr
- 120 Rockport Rd
- 45 Mayo Rd
- 5 Upham Way Unit 5
- 51 Boulder Brook Rd
- 22 Fox Hill Dr
- 428 Weston Rd
- 50 Upson Rd
- 30 Colby Rd
- 13 Cavanaugh Rd
- 33 Royalston Rd
- 46 Royalston Rd
- 620 South Ave
- 365 Weston Rd
- 23 Pilgrim Rd
- 106 Willow Brook Dr Unit 106
- 6 Wilde Rd