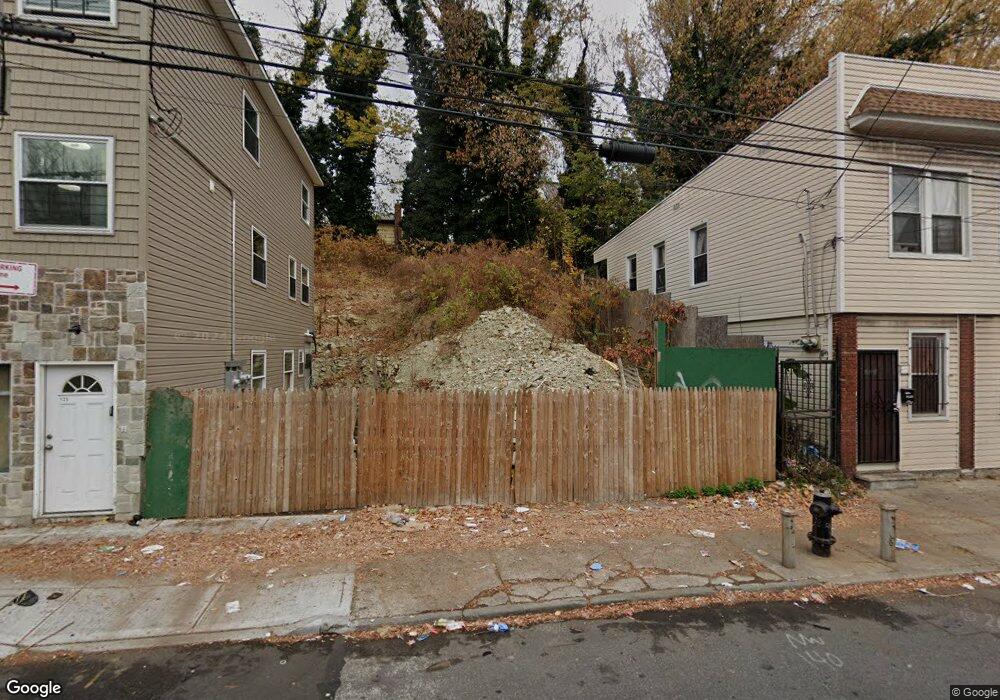
123 Brook St Staten Island, NY 10301
New Brighton NeighborhoodEstimated Value: $145,000 - $865,000
--
Bed
4
Baths
--
Sq Ft
4,792
Sq Ft Lot
About This Home
This home is located at 123 Brook St, Staten Island, NY 10301 and is currently estimated at $512,324. 123 Brook St is a home located in Richmond County with nearby schools including P.S. 16 John J Driscoll, P.S. 74 Future Leaders Elementary School, and Fort Hill Collaborative Elementary.
Ownership History
Date
Name
Owned For
Owner Type
Purchase Details
Closed on
Jun 10, 2016
Sold by
Nesslex Coportion New York City Departme
Bought by
Galarza John
Current Estimated Value
Purchase Details
Closed on
Sep 14, 2015
Sold by
Nesslex Corporation
Bought by
Christoffersen Alan
Purchase Details
Closed on
Sep 21, 2010
Sold by
123 Brook Street Llc
Bought by
Nesslex Corporation
Purchase Details
Closed on
Sep 28, 2005
Sold by
Raymond Holding Inc
Bought by
123 Brook Street Llc
Purchase Details
Closed on
Jul 21, 2005
Sold by
Best Home Properties Inc
Bought by
Raymond Holdings Inc
Purchase Details
Closed on
Jan 25, 2005
Sold by
Darden Bobbie and Beckford June
Bought by
Best Home Properties Inc
Home Financials for this Owner
Home Financials are based on the most recent Mortgage that was taken out on this home.
Original Mortgage
$55,000
Interest Rate
5.87%
Mortgage Type
Stand Alone First
Create a Home Valuation Report for This Property
The Home Valuation Report is an in-depth analysis detailing your home's value as well as a comparison with similar homes in the area
Home Values in the Area
Average Home Value in this Area
Purchase History
| Date | Buyer | Sale Price | Title Company |
|---|---|---|---|
| Galarza John | $29,000 | Old Republic Natl Title Ins | |
| Christoffersen Alan | $357,000 | The Judicial Title Ins Agenc | |
| Nesslex Corporation | $76,368 | The Judicial Title Insurance | |
| 123 Brook Street Llc | $120,000 | -- | |
| Raymond Holdings Inc | $95,000 | Fidelity Natl Title Ins Co | |
| Best Home Properties Inc | $45,000 | Lawyers Title Ins |
Source: Public Records
Mortgage History
| Date | Status | Borrower | Loan Amount |
|---|---|---|---|
| Previous Owner | Best Home Properties Inc | $55,000 |
Source: Public Records
Tax History Compared to Growth
Tax History
| Year | Tax Paid | Tax Assessment Tax Assessment Total Assessment is a certain percentage of the fair market value that is determined by local assessors to be the total taxable value of land and additions on the property. | Land | Improvement |
|---|---|---|---|---|
| 2025 | $1,217 | $7,320 | $6,424 | $896 |
| 2024 | $1,217 | $6,060 | $6,624 | -- |
| 2023 | $1,279 | $6,472 | $6,472 | $0 |
| 2022 | $1,219 | $6,600 | $6,600 | $0 |
| 2021 | $1,212 | $5,760 | $5,760 | $0 |
| 2020 | $17,361 | $5,520 | $5,520 | $0 |
| 2019 | $16,123 | $36,000 | $36,000 | $0 |
| 2018 | $4,684 | $44,550 | $44,550 | $0 |
| 2017 | $5,473 | $55,800 | $55,800 | $0 |
| 2016 | $5,276 | $54,000 | $54,000 | $0 |
| 2015 | $4,971 | $53,550 | $53,550 | $0 |
| 2014 | $4,971 | $48,150 | $48,150 | $0 |
Source: Public Records
Map
Nearby Homes
- 192 Corson Ave
- 12 Castleton Ave
- 102 Winter Ave
- 65 Brook St
- 446 Jersey St Unit 448
- 29 Stanley Ave
- 32 Scribner Ave
- 50 Brook St
- 416 Westervelt Ave
- 19 Scribner Ave
- 18 Ely St
- 38 Brighton Ave
- 181 Benziger Ave
- 11 Bayview Place
- 80 Corson Ave
- 0 Van Tuyl St
- 118 Hendricks Ave
- 138 Hendricks Ave
- 70 Brighton Ave
- 19 Tilden St
- 121 Brook St
- 119 Brook St
- 125 Brook St Unit 2
- 125 Brook St Unit 3
- 125 Brook St
- 117 Brook St
- 115 Brook St Unit 5
- 115 Brook St
- 190 Corson Ave
- 186 Corson Ave
- 184 Corson Ave
- 182 Corson Ave
- 143 Brook St
- 513-517 Jersey St
- 180 Corson Ave
- 196 Corson Ave
- 511 Jersey St
- 198 Corson Ave
- 517 Jersey St
- 497 Jersey St