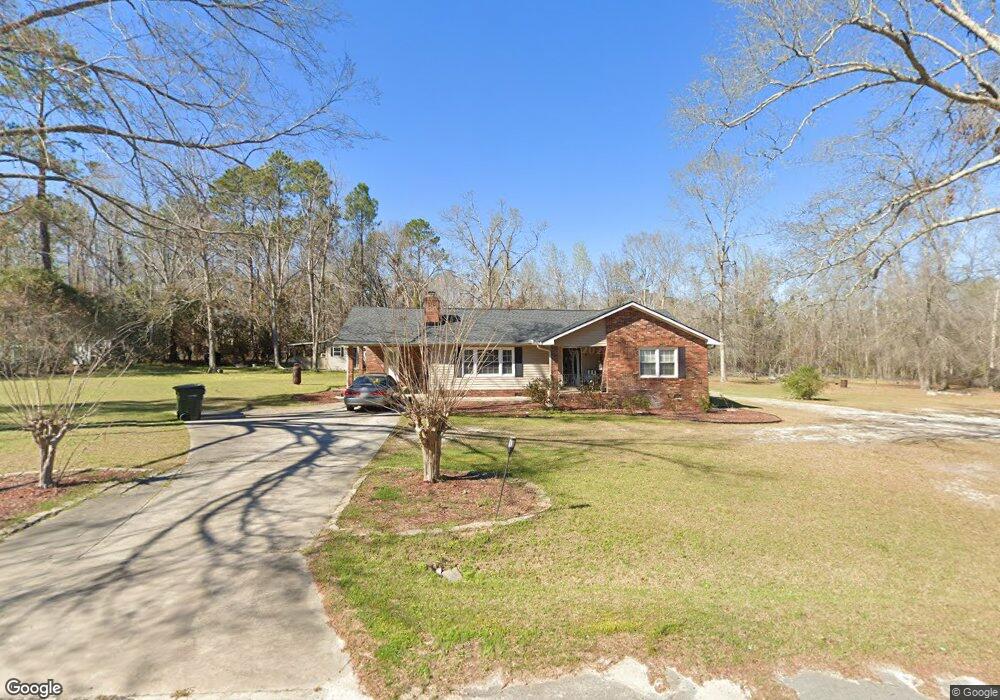
123 Carl Durden St Twin City, GA 30471
Estimated Value: $285,000 - $796,000
3
Beds
3
Baths
2,526
Sq Ft
$188/Sq Ft
Est. Value
About This Home
This home is located at 123 Carl Durden St, Twin City, GA 30471 and is currently estimated at $475,009, approximately $188 per square foot. 123 Carl Durden St is a home located in Candler County with nearby schools including Twin City Elementary School.
Ownership History
Date
Name
Owned For
Owner Type
Purchase Details
Closed on
Jul 31, 2015
Sold by
Cowan Jimmie Wayne
Bought by
Sieg Lynne
Current Estimated Value
Home Financials for this Owner
Home Financials are based on the most recent Mortgage that was taken out on this home.
Original Mortgage
$160,000
Outstanding Balance
$126,180
Interest Rate
4.11%
Mortgage Type
New Conventional
Estimated Equity
$348,829
Purchase Details
Closed on
Jul 17, 2014
Sold by
Cowan Kathryn M
Bought by
Cowan Jimmie Wayne
Purchase Details
Closed on
Feb 26, 2010
Sold by
Bryant Ray E
Bought by
Cowan Jimmie W and Cowan Kathryn M
Purchase Details
Closed on
Jan 22, 2010
Sold by
Bryant Ray and Bryant Carrie
Bought by
Cowan Jimmie W and Cowan Kathryn M
Purchase Details
Closed on
May 1, 1993
Sold by
Casey James and Casey Lilli
Bought by
Bryant Ray and Bryant Carrie
Purchase Details
Closed on
Mar 1, 1988
Sold by
Bird Pat
Bought by
Casey James and Casey Lilli
Purchase Details
Closed on
May 1, 1987
Bought by
Bird Pat
Create a Home Valuation Report for This Property
The Home Valuation Report is an in-depth analysis detailing your home's value as well as a comparison with similar homes in the area
Home Values in the Area
Average Home Value in this Area
Purchase History
| Date | Buyer | Sale Price | Title Company |
|---|---|---|---|
| Sieg Lynne | $209,000 | -- | |
| Cowan Jimmie Wayne | -- | -- | |
| Cowan Jimmie W | $189,000 | -- | |
| Cowan Jimmie W | -- | -- | |
| Bryant Ray | $122,500 | -- | |
| Casey James | $1,800 | -- | |
| Bird Pat | -- | -- |
Source: Public Records
Mortgage History
| Date | Status | Borrower | Loan Amount |
|---|---|---|---|
| Open | Sieg Lynne | $160,000 |
Source: Public Records
Tax History Compared to Growth
Tax History
| Year | Tax Paid | Tax Assessment Tax Assessment Total Assessment is a certain percentage of the fair market value that is determined by local assessors to be the total taxable value of land and additions on the property. | Land | Improvement |
|---|---|---|---|---|
| 2024 | $4,155 | $138,001 | $4,325 | $133,676 |
| 2023 | $4,155 | $133,087 | $4,325 | $128,762 |
| 2022 | $3,264 | $105,382 | $4,325 | $101,057 |
| 2021 | $2,863 | $93,702 | $4,325 | $89,377 |
| 2020 | $2,279 | $70,692 | $4,325 | $66,367 |
| 2019 | $2,168 | $66,410 | $4,325 | $62,085 |
| 2018 | $1,665 | $59,787 | $3,868 | $55,919 |
| 2017 | $1,564 | $59,787 | $3,868 | $55,919 |
| 2016 | $1,953 | $59,787 | $3,868 | $55,919 |
| 2015 | $1,764 | $60,536 | $3,868 | $56,669 |
| 2014 | $1,764 | $60,536 | $3,868 | $56,669 |
Source: Public Records
Map
Nearby Homes
- 1120 5th Ave
- 912 5th Ave
- 211 6th Ave
- 0 Scarboro Church Rd Unit 25066343
- 317 5th Ave
- 519 Wilson Rd
- S S Old Reidsville Rd
- 889 Ga Highway 192 N
- 211 S Railroad St
- 405 Monroe St
- 3770 Hill Rd
- 56 Rock Creek Rd
- 184 Eagle Pass
- 760 Memphis Rd
- 0 S Old Reidsville Rd Unit 10556290
- 11 Plantation Dr
- 1176 Georgia 57
- 1073 Hawhammock Ch Rd
- 875 Prosperity Dr
- 0 Martin Rd Unit 23293548
- 120 Carl Durden St
- 113 Carl Durden St
- 205 Apple Ave
- 103 Old Metter Rd
- 33 Bb Sutton Rd
- 412 Plum Ave
- 409 Plum Ave
- 111 Old Metter Rd
- 218 Apple Ave
- 1029 5th Ave
- 127 Old Metter Rd
- 1019 5th Ave
- 1034 5th Ave
- 1123 5th Ave
- 0 Old Metter Rd Unit 8828827
- 0 Old Metter Rd Unit 8854682
- 0 Old Metter Rd
- 121 Old Metter Rd
- 117 Old Metter Rd
- 1126 5th Ave