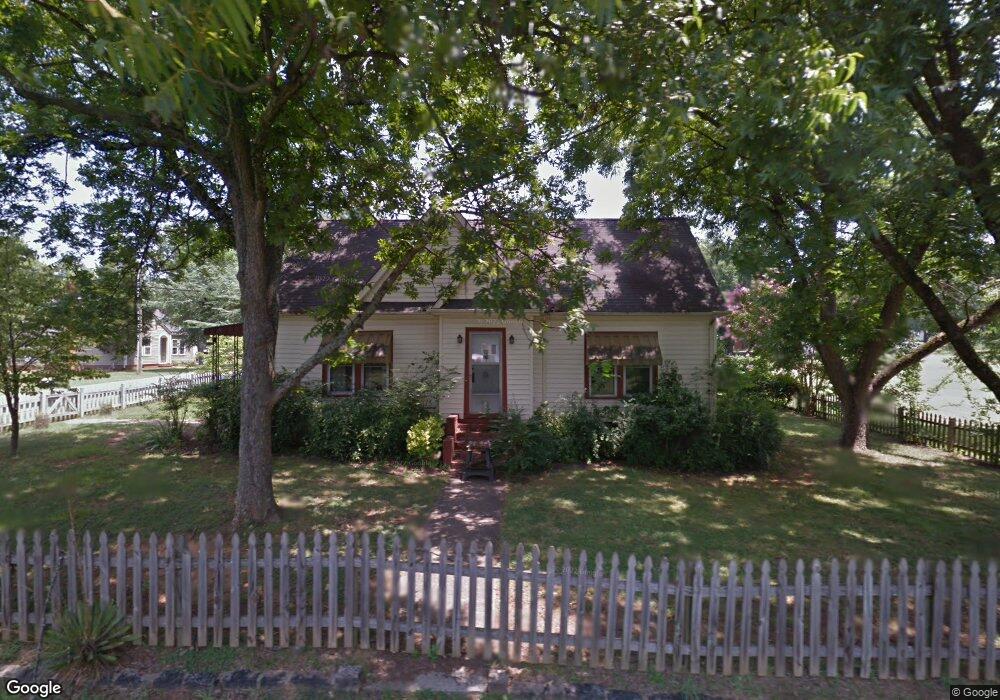
123 Cline St Concord, NC 28027
Estimated Value: $243,000 - $278,935
2
Beds
1
Bath
1,528
Sq Ft
$171/Sq Ft
Est. Value
About This Home
This home is located at 123 Cline St, Concord, NC 28027 and is currently estimated at $261,984, approximately $171 per square foot. 123 Cline St is a home located in Cabarrus County with nearby schools including Winecoff Elementary School, Northwest Cabarrus Middle School, and Northwest Cabarrus High.
Ownership History
Date
Name
Owned For
Owner Type
Purchase Details
Closed on
Feb 13, 2024
Sold by
Parke Jeffrey S and Parke Roberta L
Bought by
Redman Allyson C
Current Estimated Value
Home Financials for this Owner
Home Financials are based on the most recent Mortgage that was taken out on this home.
Original Mortgage
$267,000
Outstanding Balance
$262,532
Interest Rate
6.9%
Mortgage Type
New Conventional
Estimated Equity
-$548
Purchase Details
Closed on
Jul 28, 2000
Sold by
Dellinger William Calvin and Dellinger Connie Nichols
Bought by
Parke Jeffery S and Parke Roberta L
Home Financials for this Owner
Home Financials are based on the most recent Mortgage that was taken out on this home.
Original Mortgage
$99,650
Interest Rate
8.23%
Mortgage Type
Purchase Money Mortgage
Purchase Details
Closed on
May 1, 1984
Bought by
Dellinger William Calvin
Create a Home Valuation Report for This Property
The Home Valuation Report is an in-depth analysis detailing your home's value as well as a comparison with similar homes in the area
Home Values in the Area
Average Home Value in this Area
Purchase History
| Date | Buyer | Sale Price | Title Company |
|---|---|---|---|
| Redman Allyson C | $275,000 | None Listed On Document | |
| Redman Allyson C | $275,000 | None Listed On Document | |
| Parke Jeffery S | $105,000 | -- | |
| Dellinger William Calvin | $40,000 | -- |
Source: Public Records
Mortgage History
| Date | Status | Borrower | Loan Amount |
|---|---|---|---|
| Open | Redman Allyson C | $267,000 | |
| Closed | Redman Allyson C | $267,000 | |
| Previous Owner | Parke Jeffery S | $99,650 |
Source: Public Records
Tax History
| Year | Tax Paid | Tax Assessment Tax Assessment Total Assessment is a certain percentage of the fair market value that is determined by local assessors to be the total taxable value of land and additions on the property. | Land | Improvement |
|---|---|---|---|---|
| 2025 | $3,047 | $268,320 | $65,000 | $203,320 |
| 2024 | $2,622 | $230,870 | $65,000 | $165,870 |
| 2023 | $1,855 | $135,380 | $36,400 | $98,980 |
| 2022 | $1,855 | $135,380 | $36,400 | $98,980 |
| 2021 | $1,855 | $135,380 | $36,400 | $98,980 |
| 2020 | $1,855 | $135,380 | $36,400 | $98,980 |
| 2019 | $1,449 | $105,800 | $22,100 | $83,700 |
| 2018 | $1,428 | $105,800 | $22,100 | $83,700 |
| 2017 | $1,407 | $105,800 | $22,100 | $83,700 |
| 2016 | $1,407 | $114,700 | $32,500 | $82,200 |
| 2015 | $1,445 | $114,700 | $32,500 | $82,200 |
| 2014 | $1,445 | $114,700 | $32,500 | $82,200 |
Source: Public Records
Map
Nearby Homes
- 2475 Hedgecliff Rd
- 3000 Big Bend Dr
- 3020 Big Bend Dr
- 2485 Hedgecliff Rd
- 3050 Big Bend Dr
- 3060 Big Bend Dr
- 2515 Hedgecliff Rd
- 2525 Hedgecliff Rd
- 2535 Hedgecliff Rd
- 2545 Hedgecliff Rd
- 2818 S Ridge Ave
- 3115 Big Bend Dr
- 3125 Big Bend Dr
- 3135 Big Bend Dr
- 121 Greenview Dr
- 128 Greenview Dr
- 0 Kannapolis Hwy
- 2203 Oakhurst Ct
- 2116 S Main St
- 103 Carriage House Dr
Your Personal Tour Guide
Ask me questions while you tour the home.