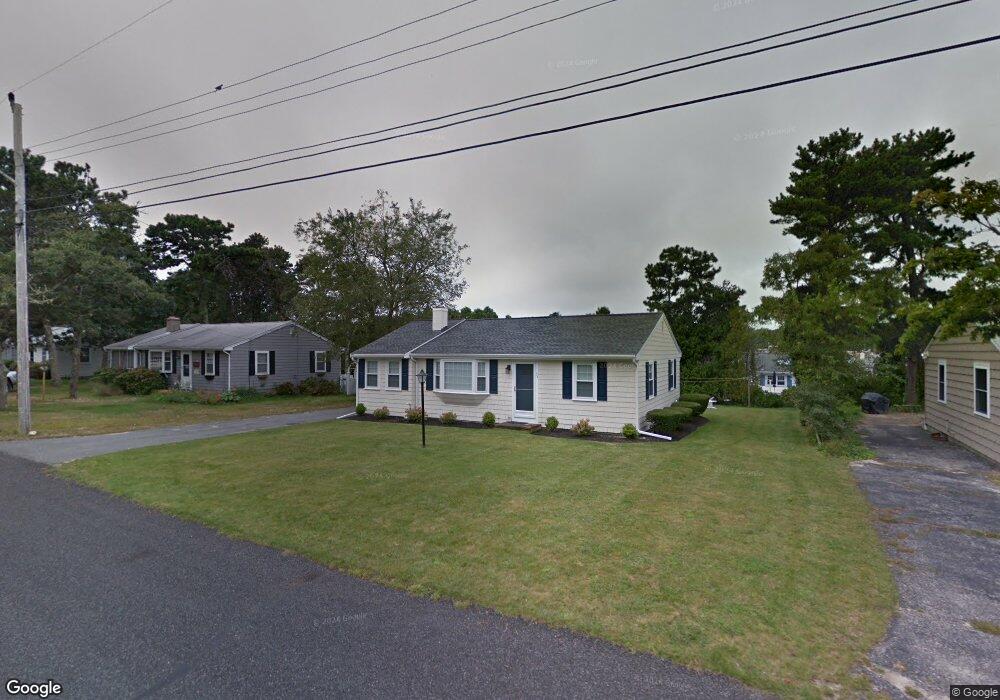
123 Cornell Dr Dennis Port, MA 02639
Dennis Port NeighborhoodEstimated Value: $560,000 - $606,687
3
Beds
1
Bath
1,102
Sq Ft
$529/Sq Ft
Est. Value
About This Home
This home is located at 123 Cornell Dr, Dennis Port, MA 02639 and is currently estimated at $583,422, approximately $529 per square foot. 123 Cornell Dr is a home located in Barnstable County with nearby schools including Dennis-Yarmouth Regional High School and St. Pius X. School.
Ownership History
Date
Name
Owned For
Owner Type
Purchase Details
Closed on
Jan 20, 2022
Sold by
Lacey Thomas J and Lacey Michele A
Bought by
Lacey Ft
Current Estimated Value
Purchase Details
Closed on
Jan 31, 2007
Sold by
Ahern Barbara A
Bought by
Lacey Michele A and Lacey Thomas J
Home Financials for this Owner
Home Financials are based on the most recent Mortgage that was taken out on this home.
Original Mortgage
$190,000
Interest Rate
6.16%
Mortgage Type
Purchase Money Mortgage
Purchase Details
Closed on
Apr 13, 2001
Sold by
Wentworth Judith A and Ahern Stephen H
Bought by
Ahern Joseph G and Ahern Barbara A
Home Financials for this Owner
Home Financials are based on the most recent Mortgage that was taken out on this home.
Original Mortgage
$135,900
Interest Rate
6.97%
Mortgage Type
Purchase Money Mortgage
Create a Home Valuation Report for This Property
The Home Valuation Report is an in-depth analysis detailing your home's value as well as a comparison with similar homes in the area
Home Values in the Area
Average Home Value in this Area
Purchase History
| Date | Buyer | Sale Price | Title Company |
|---|---|---|---|
| Lacey Ft | -- | None Available | |
| Lacey Michele A | $270,000 | -- | |
| Ahern Joseph G | $169,900 | -- |
Source: Public Records
Mortgage History
| Date | Status | Borrower | Loan Amount |
|---|---|---|---|
| Previous Owner | Lacey Michele A | $190,000 | |
| Previous Owner | Ahern Joseph G | $135,900 |
Source: Public Records
Tax History Compared to Growth
Tax History
| Year | Tax Paid | Tax Assessment Tax Assessment Total Assessment is a certain percentage of the fair market value that is determined by local assessors to be the total taxable value of land and additions on the property. | Land | Improvement |
|---|---|---|---|---|
| 2025 | $2,245 | $518,500 | $202,200 | $316,300 |
| 2024 | $2,114 | $481,500 | $194,500 | $287,000 |
| 2023 | $2,045 | $437,800 | $176,800 | $261,000 |
| 2022 | $1,966 | $351,000 | $159,300 | $191,700 |
| 2021 | $2,076 | $344,200 | $178,400 | $165,800 |
| 2020 | $1,870 | $306,500 | $156,100 | $150,400 |
| 2019 | $1,781 | $288,600 | $153,100 | $135,500 |
| 2018 | $1,695 | $267,300 | $145,700 | $121,600 |
| 2017 | $1,553 | $252,600 | $135,300 | $117,300 |
| 2016 | $1,598 | $244,700 | $145,700 | $99,000 |
| 2015 | $1,566 | $244,700 | $145,700 | $99,000 |
| 2014 | $1,422 | $223,900 | $124,900 | $99,000 |
Source: Public Records
Map
Nearby Homes
- 19 Standish Way
- 80 Michaels Ave
- 4 Coffey Ln
- 22 Wixon Rd
- 31 Easy St
- 71 Main St
- 125 Main St Unit 3
- 12 Spoonbill Rd
- 72 Bassett Ln
- 268 Main St
- 15 Woodside Park Rd
- 37 Ocean Dr Unit 2
- 95 Center St
- 64 Beaten Rd
- 26 Center St
- 61 Trotters Ln
- 22 Ferncliff Rd
- 37 Beach Hills Rd
- 37-A Beach Hills Rd
- 112 Old Wharf Rd Unit E4