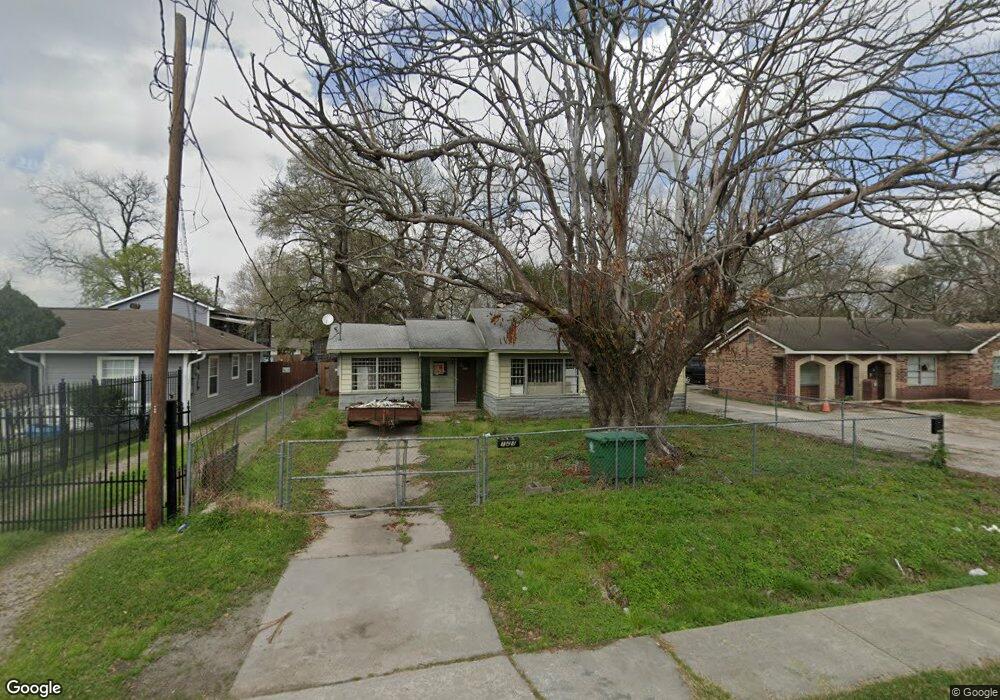
123 De Boll St Houston, TX 77022
Northside-Northline NeighborhoodEstimated Value: $238,000 - $318,000
2
Beds
3
Baths
2,575
Sq Ft
$110/Sq Ft
Est. Value
About This Home
This home is located at 123 De Boll St, Houston, TX 77022 and is currently estimated at $283,414, approximately $110 per square foot. 123 De Boll St is a home located in Harris County with nearby schools including Burbank Elementary School, Burbank Middle School, and Sam Houston Math, Science & Technology Center.
Ownership History
Date
Name
Owned For
Owner Type
Purchase Details
Closed on
May 13, 2003
Sold by
Woodrum Marcia Dolores
Bought by
Pena Ismael
Current Estimated Value
Home Financials for this Owner
Home Financials are based on the most recent Mortgage that was taken out on this home.
Original Mortgage
$75,000
Outstanding Balance
$32,596
Interest Rate
5.79%
Mortgage Type
Stand Alone First
Estimated Equity
$250,818
Purchase Details
Closed on
Jan 16, 2001
Sold by
Stout Thomas Allen
Bought by
Woodrum Marcia Dolores
Purchase Details
Closed on
Jun 9, 2000
Sold by
Adair Donald M and Adair Dorothy Ann
Bought by
Woodrum Marcia Dolores and Stout Thomas Allen
Create a Home Valuation Report for This Property
The Home Valuation Report is an in-depth analysis detailing your home's value as well as a comparison with similar homes in the area
Home Values in the Area
Average Home Value in this Area
Purchase History
| Date | Buyer | Sale Price | Title Company |
|---|---|---|---|
| Pena Ismael | -- | Fidelity National Title | |
| Woodrum Marcia Dolores | -- | -- | |
| Woodrum Marcia Dolores | -- | -- |
Source: Public Records
Mortgage History
| Date | Status | Borrower | Loan Amount |
|---|---|---|---|
| Open | Pena Ismael | $75,000 |
Source: Public Records
Tax History
| Year | Tax Paid | Tax Assessment Tax Assessment Total Assessment is a certain percentage of the fair market value that is determined by local assessors to be the total taxable value of land and additions on the property. | Land | Improvement |
|---|---|---|---|---|
| 2025 | $5,462 | $285,693 | $123,728 | $161,965 |
| 2024 | $5,462 | $261,047 | $113,553 | $147,494 |
| 2023 | $5,462 | $279,767 | $69,190 | $210,577 |
| 2022 | $5,206 | $236,454 | $69,190 | $167,264 |
| 2021 | $4,735 | $203,169 | $69,190 | $133,979 |
| 2020 | $4,542 | $187,548 | $69,190 | $118,358 |
| 2019 | $4,640 | $183,384 | $56,980 | $126,404 |
| 2018 | $3,637 | $143,717 | $47,619 | $96,098 |
| 2017 | $3,634 | $143,717 | $47,619 | $96,098 |
| 2016 | $3,433 | $135,755 | $44,770 | $90,985 |
| 2015 | $2,456 | $95,521 | $32,560 | $62,961 |
| 2014 | $2,456 | $95,521 | $32,560 | $62,961 |
Source: Public Records
Map
Nearby Homes
- 9201 Fulton St
- 253 De Boll St
- 267 De Boll St
- 161 Luther St
- 202 Burbank St
- 61 Trenwood Ln
- 0 Veenstra St
- 9625 Fulton St
- 56 Trenwood Ln
- 9713 Clark Rd
- 9711 Marydel St
- 91 Burbank St
- 56 Wellford St
- 108 Luetta St
- 8715 Bauman Rd Unit 6
- 219 Heaney Dr
- 61 Berry Rd
- 9026 Mcgallion Rd
- 30 Wellford St
- 9902 Clark Rd Unit D
Your Personal Tour Guide
Ask me questions while you tour the home.