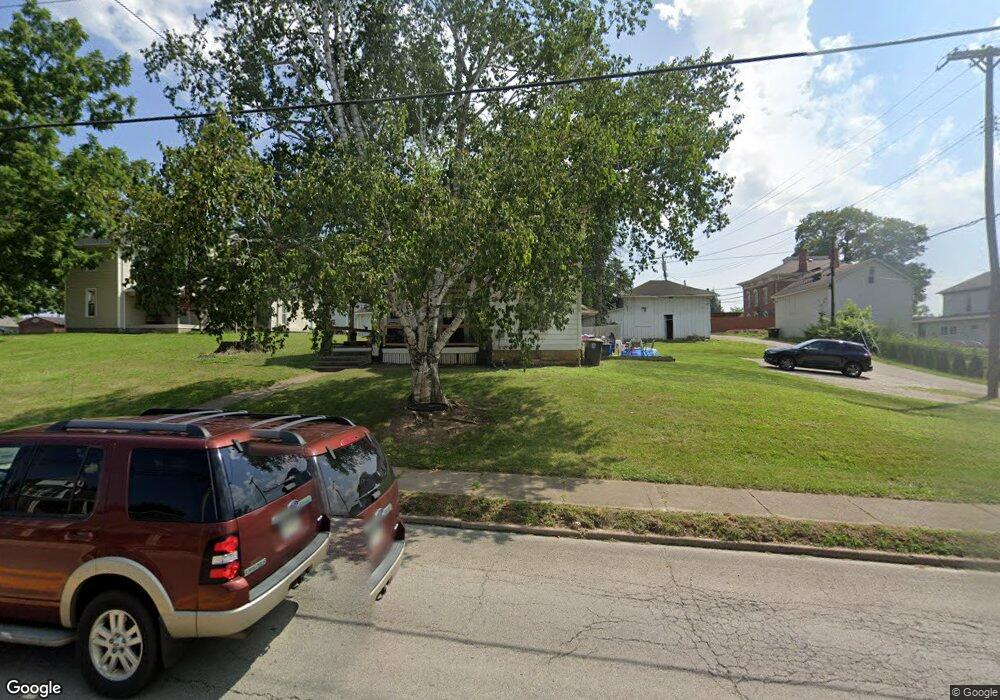
123 E Broadway St Covington, OH 45318
Estimated Value: $193,709 - $270,000
4
Beds
2
Baths
1,952
Sq Ft
$117/Sq Ft
Est. Value
About This Home
This home is located at 123 E Broadway St, Covington, OH 45318 and is currently estimated at $228,177, approximately $116 per square foot. 123 E Broadway St is a home located in Miami County with nearby schools including Covington Elementary/Junior High School, Covington Junior High School, and Covington High School.
Ownership History
Date
Name
Owned For
Owner Type
Purchase Details
Closed on
Jan 3, 2020
Sold by
Peterson Gail
Bought by
Solomon Richard A and Solomon Angela K
Current Estimated Value
Home Financials for this Owner
Home Financials are based on the most recent Mortgage that was taken out on this home.
Original Mortgage
$47,500
Outstanding Balance
$31,005
Interest Rate
3.6%
Mortgage Type
New Conventional
Estimated Equity
$197,172
Purchase Details
Closed on
Dec 30, 2019
Sold by
Denniags Guy
Bought by
Solomon Richard A and Solomon Angela K
Home Financials for this Owner
Home Financials are based on the most recent Mortgage that was taken out on this home.
Original Mortgage
$47,500
Outstanding Balance
$31,005
Interest Rate
3.6%
Mortgage Type
New Conventional
Estimated Equity
$197,172
Purchase Details
Closed on
May 9, 2018
Sold by
Dennings Grant
Bought by
Dennings Matthew B and Dennings Jonathon H
Purchase Details
Closed on
Jan 1, 1990
Bought by
Dennings Guy
Create a Home Valuation Report for This Property
The Home Valuation Report is an in-depth analysis detailing your home's value as well as a comparison with similar homes in the area
Home Values in the Area
Average Home Value in this Area
Purchase History
| Date | Buyer | Sale Price | Title Company |
|---|---|---|---|
| Solomon Richard A | $10,000 | None Available | |
| Solomon Richard A | $10,000 | None Available | |
| Dennings Matthew B | -- | None Available | |
| Dennings Guy | -- | -- |
Source: Public Records
Mortgage History
| Date | Status | Borrower | Loan Amount |
|---|---|---|---|
| Open | Solomon Richard A | $47,500 |
Source: Public Records
Tax History
| Year | Tax Paid | Tax Assessment Tax Assessment Total Assessment is a certain percentage of the fair market value that is determined by local assessors to be the total taxable value of land and additions on the property. | Land | Improvement |
|---|---|---|---|---|
| 2025 | $1,843 | $56,460 | $14,560 | $41,900 |
| 2024 | $1,843 | $38,850 | $15,750 | $23,100 |
| 2023 | $1,455 | $38,850 | $15,750 | $23,100 |
| 2022 | $1,452 | $38,850 | $15,750 | $23,100 |
| 2021 | $1,206 | $29,890 | $12,110 | $17,780 |
| 2020 | $1,235 | $29,890 | $12,110 | $17,780 |
| 2019 | $1,241 | $29,890 | $12,110 | $17,780 |
| 2018 | $667 | $24,920 | $7,070 | $17,850 |
| 2017 | $679 | $24,920 | $7,070 | $17,850 |
| 2016 | $671 | $24,920 | $7,070 | $17,850 |
| 2015 | $605 | $23,940 | $6,790 | $17,150 |
| 2014 | $605 | $23,940 | $6,790 | $17,150 |
| 2013 | $583 | $23,940 | $6,790 | $17,150 |
Source: Public Records
Map
Nearby Homes
- 129 E Broadway St
- 177 N Wall St
- 194 N Pearl St
- 171 N Wall St
- 110 E Broadway St
- 165 N Wall St
- 203 E Broadway St
- 200 E Broadway St
- 100 U S 36
- 260 N Wall St
- 170 N Pearl St
- 157 N Wall St
- 195 N Pearl St
- 254 N Wall St
- 210 E Broadway St
- 187 N Pearl St
- 220 N Pearl St
- 183 N Pearl St
- 160 N Pearl St
- 215 E Broadway St
Your Personal Tour Guide
Ask me questions while you tour the home.