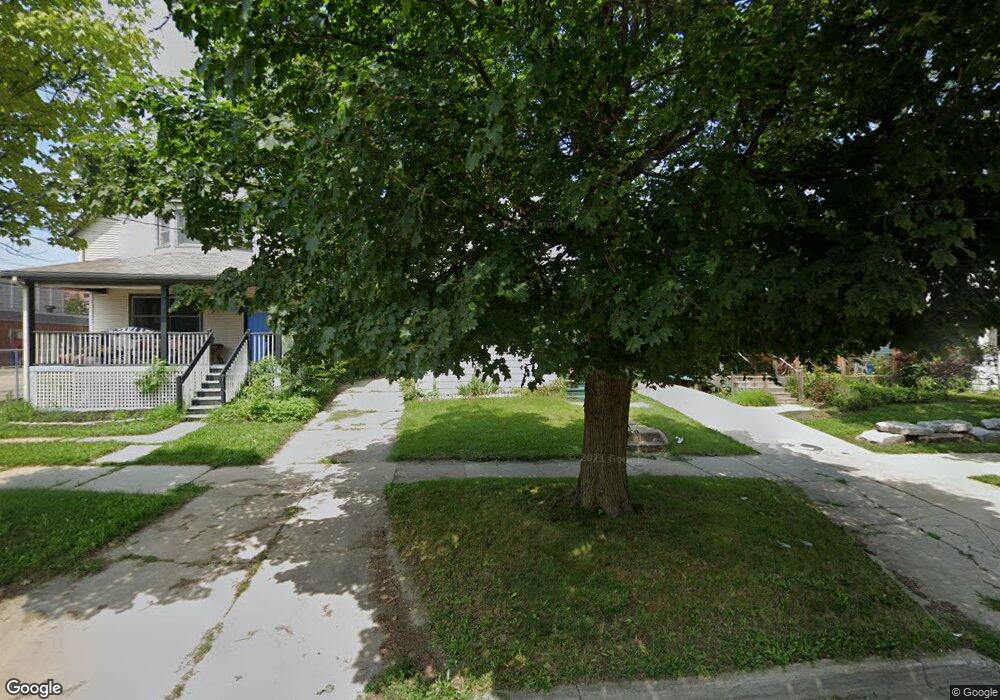
123 E Elm St Lansing, MI 48910
Reo Town NeighborhoodEstimated Value: $115,000 - $151,000
4
Beds
2
Baths
1,571
Sq Ft
$84/Sq Ft
Est. Value
About This Home
This home is located at 123 E Elm St, Lansing, MI 48910 and is currently estimated at $132,684, approximately $84 per square foot. 123 E Elm St is a home located in Ingham County with nearby schools including Riddle Elementary School, Pattengill Academy, and J.W. Sexton High School.
Ownership History
Date
Name
Owned For
Owner Type
Purchase Details
Closed on
Dec 17, 2009
Sold by
Donovan Shaun
Bought by
Brown Aaron
Current Estimated Value
Purchase Details
Closed on
May 1, 2009
Sold by
Citimortgage Inc
Bought by
The Secretary Of Housing & Urban Develop
Purchase Details
Closed on
Oct 30, 2008
Sold by
Stoller Keith E and Stoller Diana J
Bought by
Citimortgage Inc
Purchase Details
Closed on
Dec 28, 2005
Sold by
Magoola Donnette
Bought by
Stoller Keith E and Stoller Diana J
Purchase Details
Closed on
Feb 5, 1999
Sold by
Project Teamwork Corp
Bought by
Stoller Keith and Stoller Diana
Home Financials for this Owner
Home Financials are based on the most recent Mortgage that was taken out on this home.
Original Mortgage
$64,826
Interest Rate
6.92%
Mortgage Type
FHA
Purchase Details
Closed on
Aug 17, 1998
Bought by
Project Teamwork
Create a Home Valuation Report for This Property
The Home Valuation Report is an in-depth analysis detailing your home's value as well as a comparison with similar homes in the area
Home Values in the Area
Average Home Value in this Area
Purchase History
| Date | Buyer | Sale Price | Title Company |
|---|---|---|---|
| Brown Aaron | $38,500 | None Available | |
| The Secretary Of Housing & Urban Develop | -- | None Available | |
| Citimortgage Inc | $75,197 | None Available | |
| Stoller Keith E | -- | None Available | |
| Stoller Keith | $64,900 | Metropolitan Title Company | |
| Project Teamwork | -- | -- |
Source: Public Records
Mortgage History
| Date | Status | Borrower | Loan Amount |
|---|---|---|---|
| Previous Owner | Stoller Keith | $64,826 |
Source: Public Records
Tax History
| Year | Tax Paid | Tax Assessment Tax Assessment Total Assessment is a certain percentage of the fair market value that is determined by local assessors to be the total taxable value of land and additions on the property. | Land | Improvement |
|---|---|---|---|---|
| 2025 | $2,305 | $54,500 | $3,700 | $50,800 |
| 2024 | $18 | $57,800 | $3,700 | $54,100 |
| 2023 | $2,163 | $49,100 | $3,700 | $45,400 |
| 2022 | $1,952 | $47,500 | $2,800 | $44,700 |
| 2021 | $1,912 | $36,300 | $3,400 | $32,900 |
| 2020 | $1,900 | $33,000 | $3,400 | $29,600 |
| 2019 | $1,820 | $31,000 | $3,400 | $27,600 |
| 2018 | $1,707 | $29,400 | $3,400 | $26,000 |
| 2017 | $1,634 | $29,400 | $3,400 | $26,000 |
| 2016 | $1,586 | $28,900 | $3,400 | $25,500 |
| 2015 | $1,586 | $27,700 | $6,782 | $20,918 |
| 2014 | $1,586 | $27,700 | $6,782 | $20,918 |
Source: Public Records
Map
Nearby Homes
- 218 E Elm St
- 613 S Grand Ave Unit 10
- 1406 Reo Ave
- 1408 Reo Ave
- 139 Woodlawn Ave
- 227 Woodlawn Ave
- 506 Christiancy St
- 205 Moores River Dr
- 513 W Hillsdale St
- 515 W Hillsdale St
- 147 Isbell St
- 310 W Barnes Ave
- 527 Beech St
- 1515 Linval St
- 1535 Linval St
- 534 Isbell St
- 1731 Herbert St
- 1001 Raider St
- 1807 Teel Ave
- 1601 Bailey St
- 119 E Elm St
- 1026 S Grand Ave
- 127 E Elm St
- 1022 S Grand Ave
- 129 E Elm St
- 1012 S Grand Ave
- 1012 S Grand Ave
- 116 E Elm St
- 1102 S Grand Ave
- 1008 S Grand Ave
- 1008 S Grand Ave
- 1025 S Grand Ave
- 1029 S Grand Ave
- 1029 S Grand Ave
- 1025 S Grand Ave
- 1033 S Grand Ave
- 1021 S Grand Ave
- 1033 S Grand Ave
- 1021 S Grand Ave
- 1006 S Grand Ave
Your Personal Tour Guide
Ask me questions while you tour the home.