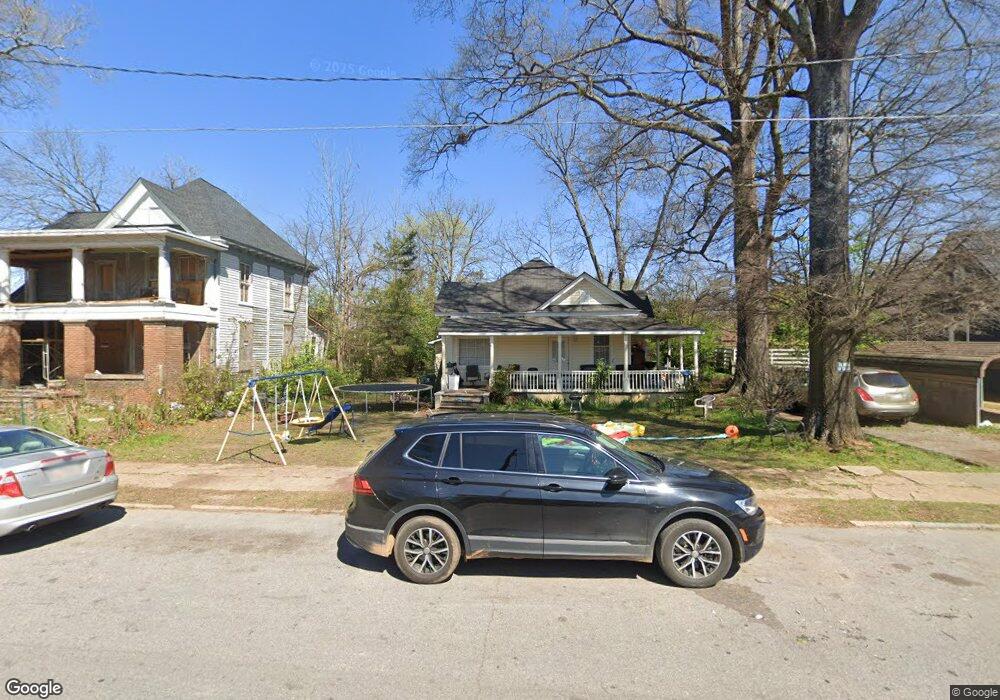
123 E Gibson St Cedartown, GA 30125
Estimated Value: $155,539 - $253,000
3
Beds
2
Baths
1,481
Sq Ft
$125/Sq Ft
Est. Value
About This Home
This home is located at 123 E Gibson St, Cedartown, GA 30125 and is currently estimated at $184,635, approximately $124 per square foot. 123 E Gibson St is a home located in Polk County with nearby schools including Cedar Christian School and Vineyard Harvester Christian Academy.
Ownership History
Date
Name
Owned For
Owner Type
Purchase Details
Closed on
Apr 18, 2024
Sold by
Cedartown City
Bought by
Frazier Ladonna
Current Estimated Value
Purchase Details
Closed on
Aug 4, 2017
Sold by
Not Provided
Bought by
J
Home Financials for this Owner
Home Financials are based on the most recent Mortgage that was taken out on this home.
Original Mortgage
$842,820
Interest Rate
3.96%
Mortgage Type
Unknown
Purchase Details
Closed on
Apr 29, 2011
Sold by
Gates James F
Bought by
Family Four Investments Llc
Purchase Details
Closed on
Dec 30, 2005
Sold by
Gates Kellilyn*A and Gates K
Bought by
Gates Franj*A and Gates K
Home Financials for this Owner
Home Financials are based on the most recent Mortgage that was taken out on this home.
Original Mortgage
$64,000
Interest Rate
6.18%
Mortgage Type
New Conventional
Purchase Details
Closed on
Jan 1, 1957
Bought by
Nation J G
Create a Home Valuation Report for This Property
The Home Valuation Report is an in-depth analysis detailing your home's value as well as a comparison with similar homes in the area
Home Values in the Area
Average Home Value in this Area
Purchase History
| Date | Buyer | Sale Price | Title Company |
|---|---|---|---|
| Frazier Ladonna | -- | -- | |
| J | $525,000 | -- | |
| Family Four Investments Llc | -- | -- | |
| Gates Franj*A | -- | -- | |
| Nation J G | -- | -- |
Source: Public Records
Mortgage History
| Date | Status | Borrower | Loan Amount |
|---|---|---|---|
| Previous Owner | J | $842,820 | |
| Previous Owner | Gates Franj*A | $64,000 |
Source: Public Records
Tax History Compared to Growth
Tax History
| Year | Tax Paid | Tax Assessment Tax Assessment Total Assessment is a certain percentage of the fair market value that is determined by local assessors to be the total taxable value of land and additions on the property. | Land | Improvement |
|---|---|---|---|---|
| 2024 | $1,269 | $40,189 | $6,000 | $34,189 |
| 2023 | $941 | $27,158 | $638 | $26,520 |
| 2022 | $645 | $27,158 | $638 | $26,520 |
| 2021 | $653 | $27,158 | $638 | $26,520 |
| 2020 | $654 | $27,158 | $638 | $26,520 |
| 2019 | $724 | $26,956 | $1,576 | $25,380 |
| 2018 | $714 | $25,926 | $1,350 | $24,576 |
| 2017 | $706 | $25,926 | $1,350 | $24,576 |
| 2016 | $706 | $25,926 | $1,350 | $24,576 |
| 2015 | $724 | $26,516 | $1,350 | $25,165 |
| 2014 | $729 | $26,516 | $1,350 | $25,165 |
Source: Public Records
Map
Nearby Homes
- 217 E Gibson St
- 226 Central St
- 129 Thompson St
- 729 S College St
- 328 330 Stubbs
- 427 Park St
- 208 Highland Ave
- 537 Fletcher St
- 234 Brooks St
- 129 W Ellawood Ave
- 151 W Ellawood Ave
- 0 Philpot Springs Unit 10626665
- 634 Georgia Ave
- 634 Georgia Ave Unit 123
- 328 Mountain Home Rd
- 601 Mountain Home Rd
- 2460 Hidden Creek Rd
- 144 Marshall St
- 149 Irwin St
- 421 Wissahickon Ave
- 117 E Gibson St
- 203 E Gibson St
- 113 E Gibson St
- 113 E Gibson St
- 209 E Gibson St
- 118 E Gibson St
- 122 E Gibson St
- 128 E Gibson St
- 210 E Gibson St
- 202 E Gibson St
- 206 E Gibson St
- 112 E Gibson St
- 701 S Main St
- 223 E Gibson St
- 0000 Puckett Rd
- 391 McAuthor St
- 218 E Gibson St
- 226 E Gibson St
- 123 Central St
- 129 Central St