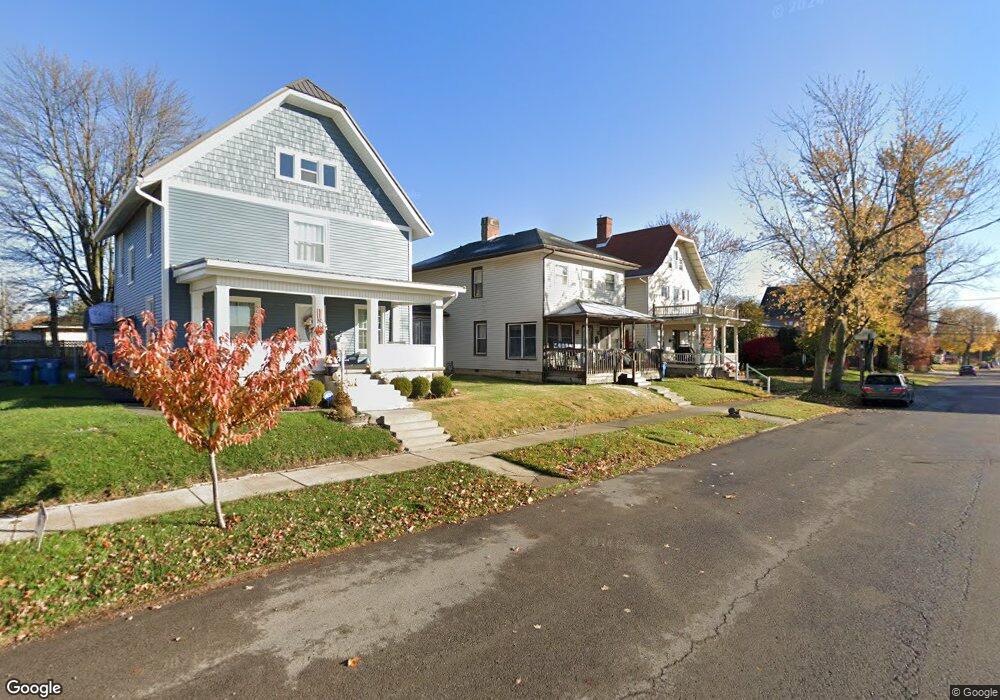
123 E North St Kenton, OH 43326
Estimated Value: $151,366 - $188,000
3
Beds
2
Baths
1,952
Sq Ft
$86/Sq Ft
Est. Value
About This Home
This home is located at 123 E North St, Kenton, OH 43326 and is currently estimated at $168,342, approximately $86 per square foot. 123 E North St is a home located in Hardin County with nearby schools including Kenton Elementary School, Kenton Middle School, and Kenton High School.
Ownership History
Date
Name
Owned For
Owner Type
Purchase Details
Closed on
Oct 28, 2024
Sold by
Holcomb Krista and Holcomb Latricia
Bought by
Price Bailey N and Price Bernice S
Current Estimated Value
Home Financials for this Owner
Home Financials are based on the most recent Mortgage that was taken out on this home.
Original Mortgage
$42,000
Outstanding Balance
$41,580
Interest Rate
6.09%
Mortgage Type
New Conventional
Estimated Equity
$126,762
Purchase Details
Closed on
Aug 28, 1991
Purchase Details
Closed on
Feb 26, 1987
Create a Home Valuation Report for This Property
The Home Valuation Report is an in-depth analysis detailing your home's value as well as a comparison with similar homes in the area
Home Values in the Area
Average Home Value in this Area
Purchase History
| Date | Buyer | Sale Price | Title Company |
|---|---|---|---|
| Price Bailey N | $65,800 | None Listed On Document | |
| Price Bailey N | $65,800 | None Listed On Document | |
| -- | -- | -- | |
| -- | $36,000 | -- |
Source: Public Records
Mortgage History
| Date | Status | Borrower | Loan Amount |
|---|---|---|---|
| Open | Price Bailey N | $42,000 | |
| Closed | Price Bailey N | $42,000 |
Source: Public Records
Tax History
| Year | Tax Paid | Tax Assessment Tax Assessment Total Assessment is a certain percentage of the fair market value that is determined by local assessors to be the total taxable value of land and additions on the property. | Land | Improvement |
|---|---|---|---|---|
| 2024 | $1,930 | $41,870 | $1,740 | $40,130 |
| 2023 | $2,177 | $41,870 | $1,740 | $40,130 |
| 2022 | $1,766 | $38,120 | $1,300 | $36,820 |
| 2021 | $1,772 | $38,120 | $1,300 | $36,820 |
| 2020 | $1,537 | $38,120 | $1,300 | $36,820 |
| 2019 | $1,214 | $31,070 | $1,240 | $29,830 |
| 2018 | $1,215 | $31,070 | $1,240 | $29,830 |
| 2017 | $1,197 | $31,070 | $1,240 | $29,830 |
| 2016 | $964 | $26,100 | $1,750 | $24,350 |
| 2015 | $941 | $26,100 | $1,750 | $24,350 |
| 2014 | $960 | $26,100 | $1,750 | $24,350 |
| 2013 | $1,152 | $27,550 | $1,750 | $25,800 |
Source: Public Records
Map
Nearby Homes
- 233 N Main St
- 215 N Main St
- 405 E Carroll St
- 405 E Carrol St Unit 405 1/2
- 310 N Market St
- 509 E Carrol St
- 0 N Barron St
- 121 S High St
- 503 Jennings St
- 416 E Eliza St
- 424 W Carrol St
- 39 Grape St
- 530 E Franklin St
- 609 W North St
- 416 Center St
- 0 Gilmore St
- 404 N Glendale St
- 79 Broadway St
- 354 S Barron St
- 89 Broadway St