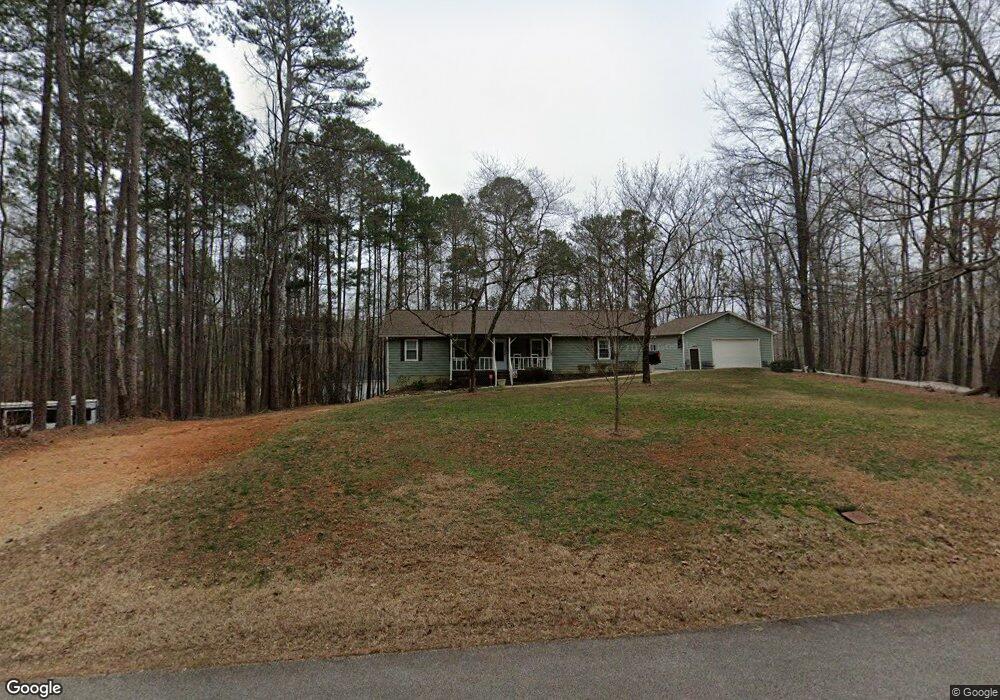
123 Elsberry Mountain Rd Dallas, GA 30132
East Paulding County NeighborhoodEstimated Value: $289,000 - $313,622
3
Beds
2
Baths
1,440
Sq Ft
$208/Sq Ft
Est. Value
About This Home
This home is located at 123 Elsberry Mountain Rd, Dallas, GA 30132 and is currently estimated at $299,656, approximately $208 per square foot. 123 Elsberry Mountain Rd is a home located in Paulding County with nearby schools including C. A. Roberts Elementary School, Lena Mae Moses Middle School, and East Paulding High School.
Ownership History
Date
Name
Owned For
Owner Type
Purchase Details
Closed on
Dec 13, 2024
Sold by
Emory Barry K
Bought by
Emory Barry K and Emory Faye
Current Estimated Value
Home Financials for this Owner
Home Financials are based on the most recent Mortgage that was taken out on this home.
Original Mortgage
$66,000
Outstanding Balance
$65,714
Interest Rate
6.78%
Mortgage Type
New Conventional
Estimated Equity
$233,942
Purchase Details
Closed on
Jun 4, 2024
Sold by
Emory Barry K
Bought by
Emory Barry K and Emory Faye
Purchase Details
Closed on
Mar 24, 2003
Sold by
Emory Barry
Bought by
Emory Barry K
Home Financials for this Owner
Home Financials are based on the most recent Mortgage that was taken out on this home.
Original Mortgage
$132,500
Interest Rate
5.74%
Mortgage Type
New Conventional
Purchase Details
Closed on
Feb 29, 2000
Sold by
Shipp Murl N
Bought by
Emory Barry
Home Financials for this Owner
Home Financials are based on the most recent Mortgage that was taken out on this home.
Original Mortgage
$103,600
Interest Rate
8.29%
Mortgage Type
FHA
Create a Home Valuation Report for This Property
The Home Valuation Report is an in-depth analysis detailing your home's value as well as a comparison with similar homes in the area
Home Values in the Area
Average Home Value in this Area
Purchase History
| Date | Buyer | Sale Price | Title Company |
|---|---|---|---|
| Emory Barry K | -- | -- | |
| Emory Barry K | -- | -- | |
| Emory Barry K | -- | -- | |
| Emory Barry | $105,000 | -- |
Source: Public Records
Mortgage History
| Date | Status | Borrower | Loan Amount |
|---|---|---|---|
| Open | Emory Barry K | $66,000 | |
| Previous Owner | Emory Barry K | $140,974 | |
| Previous Owner | Emory Barry K | $126,678 | |
| Previous Owner | Emory Barry K | $8,873 | |
| Previous Owner | Emory Barry K | $159,596 | |
| Previous Owner | Emory Barry K | $133,500 | |
| Previous Owner | Emory Barry K | $132,500 | |
| Previous Owner | Emory Barry | $103,600 |
Source: Public Records
Tax History Compared to Growth
Tax History
| Year | Tax Paid | Tax Assessment Tax Assessment Total Assessment is a certain percentage of the fair market value that is determined by local assessors to be the total taxable value of land and additions on the property. | Land | Improvement |
|---|---|---|---|---|
| 2024 | $2,694 | $111,524 | $13,840 | $97,684 |
| 2023 | $2,662 | $104,632 | $13,160 | $91,472 |
| 2022 | $2,355 | $92,204 | $11,640 | $80,564 |
| 2021 | $1,981 | $70,024 | $9,840 | $60,184 |
| 2020 | $1,798 | $62,376 | $9,400 | $52,976 |
| 2019 | $1,642 | $56,368 | $8,440 | $47,928 |
| 2018 | $1,304 | $45,148 | $8,600 | $36,548 |
| 2017 | $1,276 | $43,624 | $8,240 | $35,384 |
| 2016 | $1,148 | $39,844 | $8,240 | $31,604 |
| 2015 | $1,120 | $38,244 | $8,080 | $30,164 |
| 2014 | $1,051 | $35,164 | $7,400 | $27,764 |
| 2013 | -- | $32,280 | $8,080 | $24,200 |
Source: Public Records
Map
Nearby Homes
- 65 Riverwood View
- 39 Riverwood Glen
- 344 Riverwood Pass
- 109 Laurelwood Ln
- 392 Riverwood Dr
- The Ash Plan at Riverwood
- The Hickory Plan at Riverwood
- The Willow Plan at Riverwood
- 64 Laurelwood Ln
- 156 Hampton Terrace
- 683 Riverwood Pass
- 305 Riverwood Pass
- 719 Riverwood Pass
- 28 Rolling Rock Way
- 269 Bobo Rd
- 385 Riverwood Pass
- 363 Riverwood Pass
- 279 Riverwood Dr
- 373 Riverwood Pass
- 64 Parkview Dr
- 79 Elsberry Mountain Rd
- 155 Elsberry Mountain Rd
- 64 Smokey Path
- 82 Elsberry Mountain Rd
- 782 Bobo Rd
- 88 Smokey Path
- 65 Smokey Path
- 16 Smokey Path
- 92 Elsberry Mountain Rd
- 2 Smokey Path
- 22 Elsberry Mountain Rd
- 23 Smokey Path
- 11 Elsberry Mountain Rd
- 10 Elsberry Mountain Rd
- 12 Elsberry Mountain Rd
- 13 Elsberry Mountain Rd
- 89 Riverwood View
- 216 Riverwood Glen
- 81 Riverwood View
- 253 Elsberry Mountain Rd