Estimated Value: $58,000 - $105,000
3
Beds
1
Bath
1,344
Sq Ft
$56/Sq Ft
Est. Value
About This Home
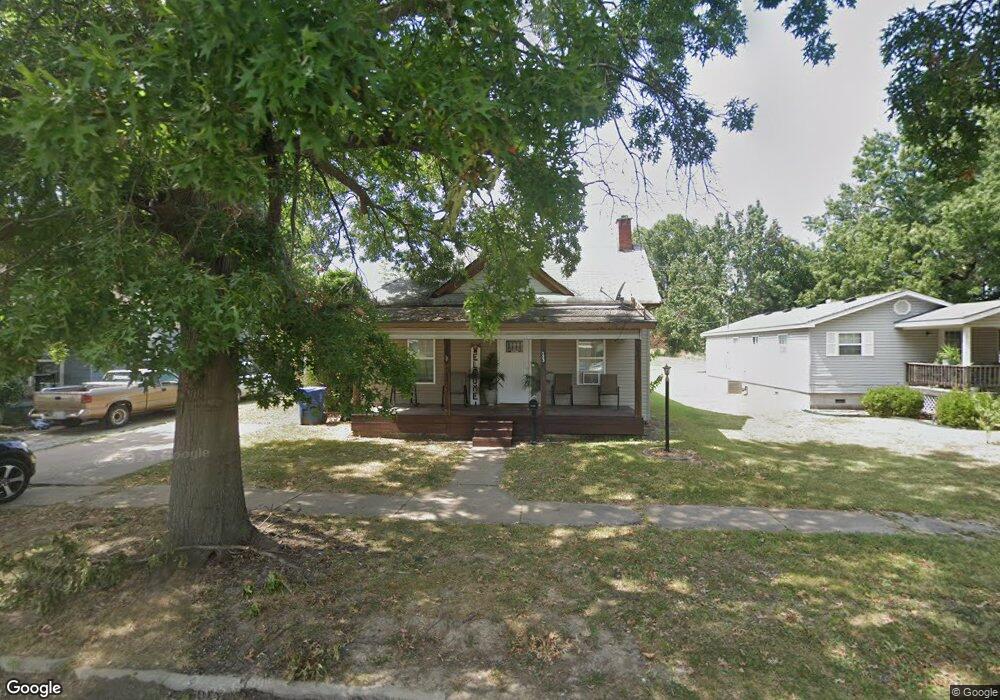
This home is located at 123 F St NE, Miami, OK 74354 and is currently estimated at $74,778, approximately $55 per square foot. 123 F St NE is a home located in Ottawa County with nearby schools including Miami High School and Mt. Olive Lutheran School.
Ownership History
Date
Name
Owned For
Owner Type
Purchase Details
Closed on
Aug 15, 2016
Sold by
Stoelzing Terry R and Stoelzing Tamra
Bought by
Cardensa Cynthia Ibarra
Current Estimated Value
Purchase Details
Closed on
May 1, 2012
Sold by
Lucas Jonathan Frederick
Bought by
Stoelzing Terry R
Purchase Details
Closed on
Jun 30, 2003
Bought by
Stoner Robert and Stoner Heather
Purchase Details
Closed on
Dec 26, 1998
Bought by
Wo Investments Inc
Purchase Details
Closed on
Feb 2, 1996
Bought by
Sanday Brian D and Sanday Terri L
Purchase Details
Closed on
Feb 1, 1995
Bought by
Paynter Joy L
Purchase Details
Closed on
Dec 2, 1994
Bought by
Sandberg Lynn and Sandberg Ronald
Create a Home Valuation Report for This Property
The Home Valuation Report is an in-depth analysis detailing your home's value as well as a comparison with similar homes in the area
Home Values in the Area
Average Home Value in this Area
Purchase History
| Date | Buyer | Sale Price | Title Company |
|---|---|---|---|
| Cardensa Cynthia Ibarra | $11,500 | None Available | |
| Stoelzing Terry R | $8,000 | None Available | |
| Stoner Robert | $18,500 | -- | |
| Wo Investments Inc | $16,000 | -- | |
| Sanday Brian D | $20,000 | -- | |
| Paynter Joy L | $17,000 | -- | |
| Sandberg Lynn | -- | -- |
Source: Public Records
Tax History Compared to Growth
Tax History
| Year | Tax Paid | Tax Assessment Tax Assessment Total Assessment is a certain percentage of the fair market value that is determined by local assessors to be the total taxable value of land and additions on the property. | Land | Improvement |
|---|---|---|---|---|
| 2025 | $138 | $1,500 | $342 | $1,158 |
| 2024 | $138 | $1,429 | $342 | $1,087 |
| 2023 | $138 | $1,361 | $342 | $1,019 |
| 2022 | $120 | $1,296 | $342 | $954 |
| 2021 | $117 | $1,235 | $342 | $893 |
| 2020 | $112 | $1,176 | $342 | $834 |
| 2019 | $92 | $1,120 | $342 | $778 |
| 2018 | $88 | $1,067 | $342 | $725 |
| 2017 | $85 | $1,016 | $342 | $674 |
| 2016 | $187 | $968 | $342 | $626 |
| 2015 | $187 | $2,109 | $310 | $1,799 |
| 2014 | $100 | $939 | $342 | $597 |
Source: Public Records
Map
Nearby Homes