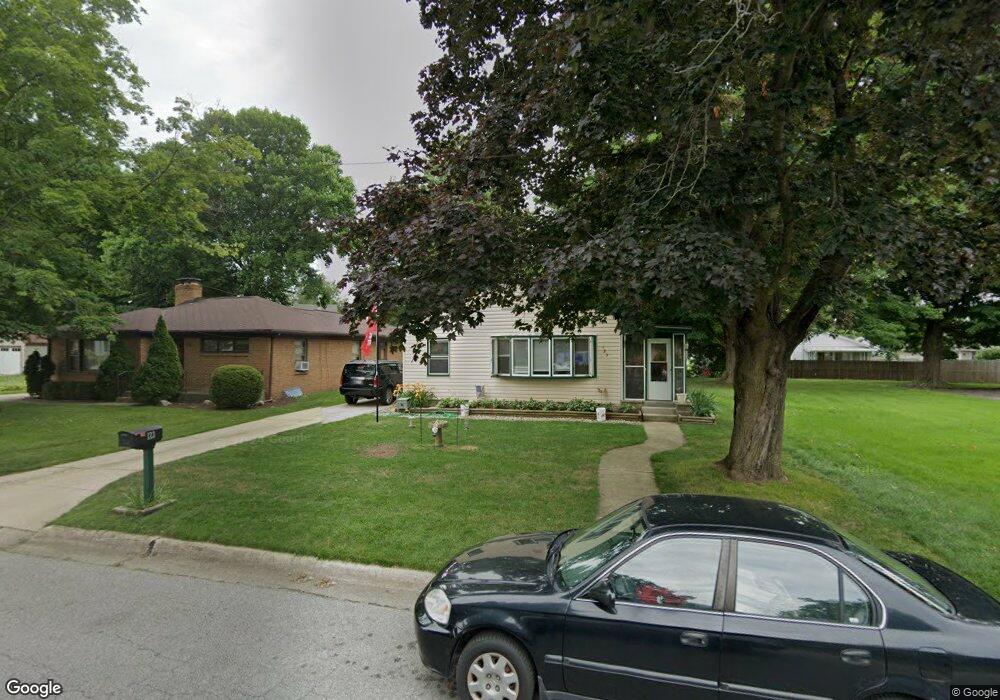
123 Farrand Ave La Porte, IN 46350
Estimated Value: $142,000 - $172,000
3
Beds
1
Bath
884
Sq Ft
$180/Sq Ft
Est. Value
About This Home
This home is located at 123 Farrand Ave, La Porte, IN 46350 and is currently estimated at $158,797, approximately $179 per square foot. 123 Farrand Ave is a home located in LaPorte County with nearby schools including Dunkerton Elementary School, Handley Elementary School, and La Porte High School.
Ownership History
Date
Name
Owned For
Owner Type
Purchase Details
Closed on
Aug 31, 2022
Sold by
Peters Angelique M
Bought by
Arneson Joel
Current Estimated Value
Home Financials for this Owner
Home Financials are based on the most recent Mortgage that was taken out on this home.
Original Mortgage
$120,000
Outstanding Balance
$114,403
Interest Rate
4.99%
Mortgage Type
VA
Estimated Equity
$44,394
Purchase Details
Closed on
Apr 20, 2011
Sold by
Ayars Bryan and Ayars Jessica
Bought by
Peters Angelique M
Home Financials for this Owner
Home Financials are based on the most recent Mortgage that was taken out on this home.
Original Mortgage
$83,252
Interest Rate
4.93%
Mortgage Type
VA
Create a Home Valuation Report for This Property
The Home Valuation Report is an in-depth analysis detailing your home's value as well as a comparison with similar homes in the area
Home Values in the Area
Average Home Value in this Area
Purchase History
| Date | Buyer | Sale Price | Title Company |
|---|---|---|---|
| Arneson Joel | -- | Drake Andrew R | |
| Peters Angelique M | -- | Metro |
Source: Public Records
Mortgage History
| Date | Status | Borrower | Loan Amount |
|---|---|---|---|
| Open | Arneson Joel | $120,000 | |
| Previous Owner | Peters Angelique M | $83,252 |
Source: Public Records
Tax History Compared to Growth
Tax History
| Year | Tax Paid | Tax Assessment Tax Assessment Total Assessment is a certain percentage of the fair market value that is determined by local assessors to be the total taxable value of land and additions on the property. | Land | Improvement |
|---|---|---|---|---|
| 2024 | $235 | $104,800 | $13,400 | $91,400 |
| 2022 | $40 | $87,800 | $11,200 | $76,600 |
| 2021 | $782 | $82,600 | $11,200 | $71,400 |
| 2020 | $568 | $82,600 | $11,200 | $71,400 |
| 2019 | $610 | $72,600 | $12,900 | $59,700 |
| 2018 | $545 | $64,300 | $10,200 | $54,100 |
| 2017 | $520 | $64,000 | $10,200 | $53,800 |
| 2016 | $504 | $61,600 | $8,900 | $52,700 |
| 2014 | $436 | $59,000 | $8,900 | $50,100 |
Source: Public Records
Map
Nearby Homes