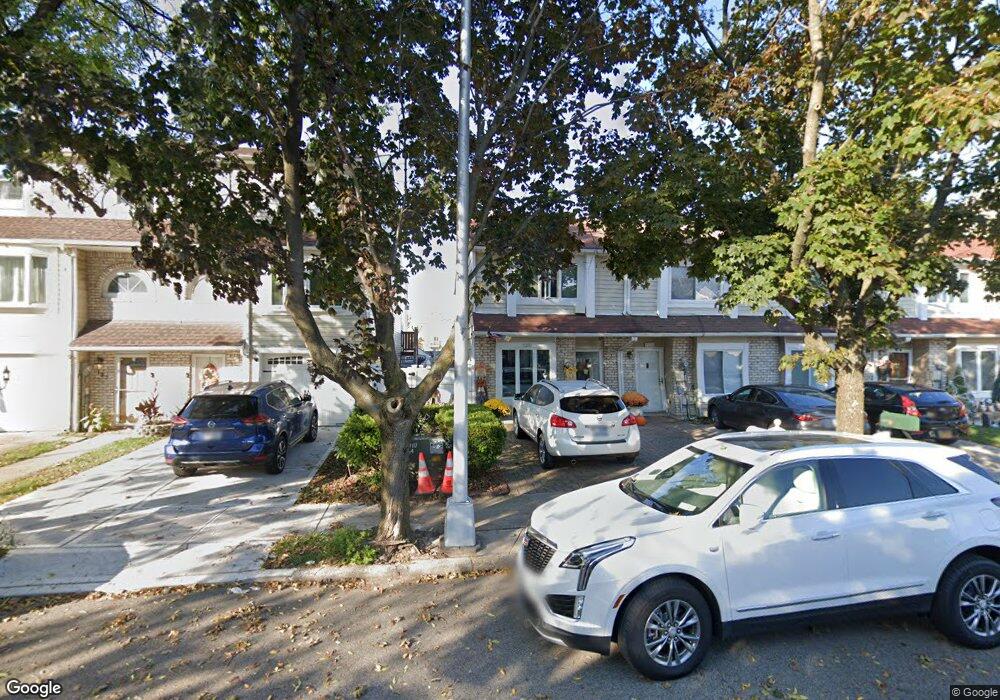
123 Gauldy Ave Staten Island, NY 10314
Bulls Head NeighborhoodEstimated Value: $515,998 - $615,000
--
Bed
4
Baths
1,110
Sq Ft
$514/Sq Ft
Est. Value
About This Home
This home is located at 123 Gauldy Ave, Staten Island, NY 10314 and is currently estimated at $570,250, approximately $513 per square foot. 123 Gauldy Ave is a home located in Richmond County with nearby schools including P.S. 060 Alice Austen School, Is 72 Rocco Laurie, and Port Richmond High School.
Ownership History
Date
Name
Owned For
Owner Type
Purchase Details
Closed on
Oct 29, 2003
Sold by
Magluilo Thomas G
Bought by
Ashenfarb Amy
Current Estimated Value
Home Financials for this Owner
Home Financials are based on the most recent Mortgage that was taken out on this home.
Original Mortgage
$195,000
Interest Rate
5.67%
Mortgage Type
Purchase Money Mortgage
Purchase Details
Closed on
Aug 29, 1995
Sold by
Sanzone Augustine
Bought by
Magluilo Thomas G
Home Financials for this Owner
Home Financials are based on the most recent Mortgage that was taken out on this home.
Original Mortgage
$105,300
Interest Rate
7.81%
Purchase Details
Closed on
Aug 24, 1995
Sold by
Sanzone Augustine and Sanzone Maria C
Bought by
Sanzone Augustine
Home Financials for this Owner
Home Financials are based on the most recent Mortgage that was taken out on this home.
Original Mortgage
$105,300
Interest Rate
7.81%
Purchase Details
Closed on
Nov 30, 1993
Sold by
Sanzone Augustine and Sanzone Maria C
Bought by
Sanzone Austine
Create a Home Valuation Report for This Property
The Home Valuation Report is an in-depth analysis detailing your home's value as well as a comparison with similar homes in the area
Home Values in the Area
Average Home Value in this Area
Purchase History
| Date | Buyer | Sale Price | Title Company |
|---|---|---|---|
| Ashenfarb Amy | $245,000 | -- | |
| Magluilo Thomas G | $117,000 | -- | |
| Sanzone Augustine | -- | Chicago Title Insurance Co | |
| Sanzone Austine | $13,500 | Chicago Title Insurance Co |
Source: Public Records
Mortgage History
| Date | Status | Borrower | Loan Amount |
|---|---|---|---|
| Previous Owner | Ashenfarb Amy | $195,000 | |
| Previous Owner | Magluilo Thomas G | $105,300 |
Source: Public Records
Tax History Compared to Growth
Tax History
| Year | Tax Paid | Tax Assessment Tax Assessment Total Assessment is a certain percentage of the fair market value that is determined by local assessors to be the total taxable value of land and additions on the property. | Land | Improvement |
|---|---|---|---|---|
| 2025 | $3,693 | $29,460 | $4,030 | $25,430 |
| 2024 | $3,705 | $29,160 | $4,071 | $25,089 |
| 2023 | $3,703 | $19,635 | $3,421 | $16,214 |
| 2022 | $3,411 | $29,580 | $6,000 | $23,580 |
| 2021 | $3,375 | $28,680 | $6,000 | $22,680 |
| 2020 | $3,194 | $24,720 | $6,000 | $18,720 |
| 2019 | $3,156 | $24,420 | $6,000 | $18,420 |
| 2018 | $3,038 | $16,363 | $4,855 | $11,508 |
| 2017 | $2,847 | $15,437 | $4,664 | $10,773 |
| 2016 | $2,602 | $14,564 | $4,713 | $9,851 |
| 2015 | $2,332 | $13,740 | $4,980 | $8,760 |
| 2014 | $2,332 | $13,740 | $4,980 | $8,760 |
Source: Public Records
Map
Nearby Homes
- 33 Brad Ln
- 23 Caswell Ave
- 963 Goethals Rd N Unit 137
- 85 Regal Walk Unit 100
- 50 Regal Walk Unit 23
- 268 Ada Dr
- 240 Fahy Ave
- 94 Wolkoff Ln Unit A
- 94 Wolkoff Ln Unit 21
- 74 Wolkoff Ln Unit A
- 81 Selvin Loop Unit A
- 81 Selvin Loop
- 148 Roman Ave
- 544 Lisk Ave Unit A
- 54 Selvin Loop Unit A
- 58 Selvin Loop Unit 153
- 277 South Ave
- 32 Amador St
- 164 Kirshon Ave
- 31 Fieldstone Rd