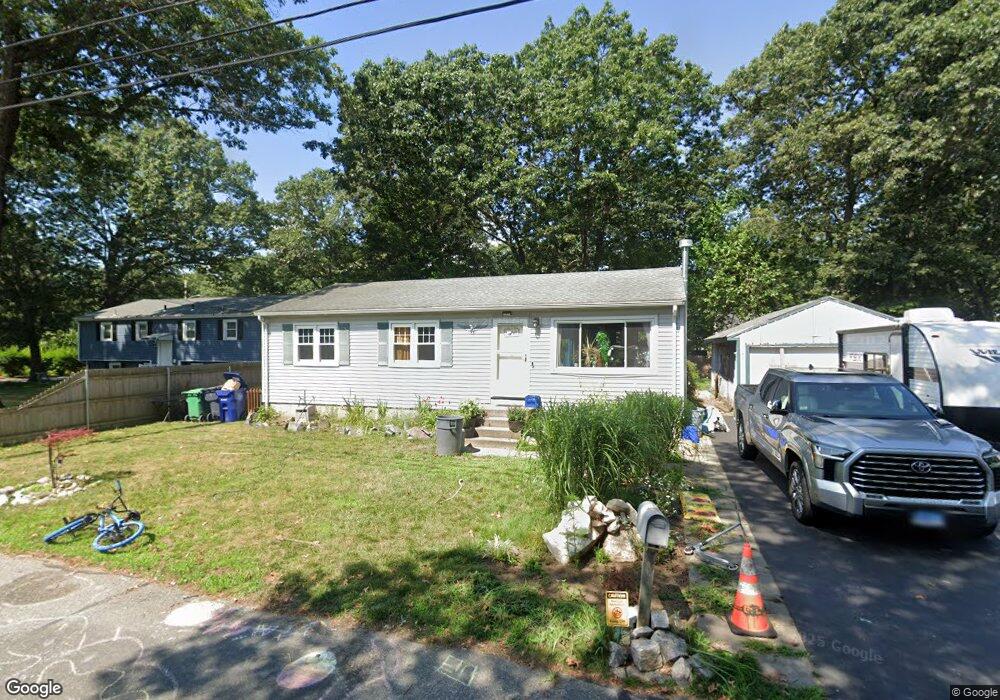
123 Haswill St Warwick, RI 02889
Buttonwoods NeighborhoodEstimated Value: $323,000 - $363,000
3
Beds
2
Baths
960
Sq Ft
$355/Sq Ft
Est. Value
About This Home
This home is located at 123 Haswill St, Warwick, RI 02889 and is currently estimated at $341,139, approximately $355 per square foot. 123 Haswill St is a home located in Kent County with nearby schools including St Rose Of Lima School and Bishop Hendricken High School.
Ownership History
Date
Name
Owned For
Owner Type
Purchase Details
Closed on
Dec 11, 2020
Sold by
Charpentier Susan L
Bought by
Charpentier Christopher and Charpentier Lea J
Current Estimated Value
Home Financials for this Owner
Home Financials are based on the most recent Mortgage that was taken out on this home.
Original Mortgage
$140,000
Outstanding Balance
$124,296
Interest Rate
2.8%
Mortgage Type
New Conventional
Estimated Equity
$216,843
Purchase Details
Closed on
Jul 31, 1997
Sold by
Olney David A and Olney Mary
Bought by
Charpentier Rene T and Charpentier Susan
Home Financials for this Owner
Home Financials are based on the most recent Mortgage that was taken out on this home.
Original Mortgage
$50,000
Interest Rate
7.55%
Mortgage Type
Purchase Money Mortgage
Create a Home Valuation Report for This Property
The Home Valuation Report is an in-depth analysis detailing your home's value as well as a comparison with similar homes in the area
Home Values in the Area
Average Home Value in this Area
Purchase History
| Date | Buyer | Sale Price | Title Company |
|---|---|---|---|
| Charpentier Christopher | $200,000 | None Available | |
| Charpentier Rene T | $104,000 | -- |
Source: Public Records
Mortgage History
| Date | Status | Borrower | Loan Amount |
|---|---|---|---|
| Open | Charpentier Christopher | $140,000 | |
| Previous Owner | Charpentier Rene T | $127,000 | |
| Previous Owner | Charpentier Rene T | $50,000 |
Source: Public Records
Tax History
| Year | Tax Paid | Tax Assessment Tax Assessment Total Assessment is a certain percentage of the fair market value that is determined by local assessors to be the total taxable value of land and additions on the property. | Land | Improvement |
|---|---|---|---|---|
| 2025 | $4,177 | $328,900 | $105,800 | $223,100 |
| 2024 | $4,095 | $283,000 | $91,900 | $191,100 |
| 2023 | $4,016 | $283,000 | $91,900 | $191,100 |
| 2022 | $3,815 | $203,700 | $60,800 | $142,900 |
| 2021 | $3,815 | $203,700 | $60,800 | $142,900 |
| 2020 | $3,815 | $203,700 | $60,800 | $142,900 |
| 2019 | $3,815 | $203,700 | $60,800 | $142,900 |
| 2018 | $3,191 | $153,400 | $57,500 | $95,900 |
| 2017 | $3,105 | $153,400 | $57,500 | $95,900 |
| 2016 | $3,105 | $153,400 | $57,500 | $95,900 |
| 2015 | $3,067 | $147,800 | $60,600 | $87,200 |
| 2014 | $2,965 | $147,800 | $60,600 | $87,200 |
| 2013 | $2,925 | $147,800 | $60,600 | $87,200 |
Source: Public Records
Map
Nearby Homes
- 165 Canfield Ave
- 176 Canfield Ave
- 201 Hollis Ave
- 72 Hollis Ave
- 81 Pinehurst Ave
- 79 Pinehurst Ave
- 96 Moccasin Dr
- 188 Wood St
- 71 Pinehurst Ave
- 73 Pinehurst Ave
- 75 Northup St
- 9 Kenneth Ave
- 31 Oakhurst Ave
- 161 Sunny Cove Dr
- 0 Sea View Dr
- 195 Oakland Beach Ave
- 107 Coburn St
- 78 Keeley Ave
- 247 Asylum Rd
- 700 Sandy Ln Unit 16
Your Personal Tour Guide
Ask me questions while you tour the home.