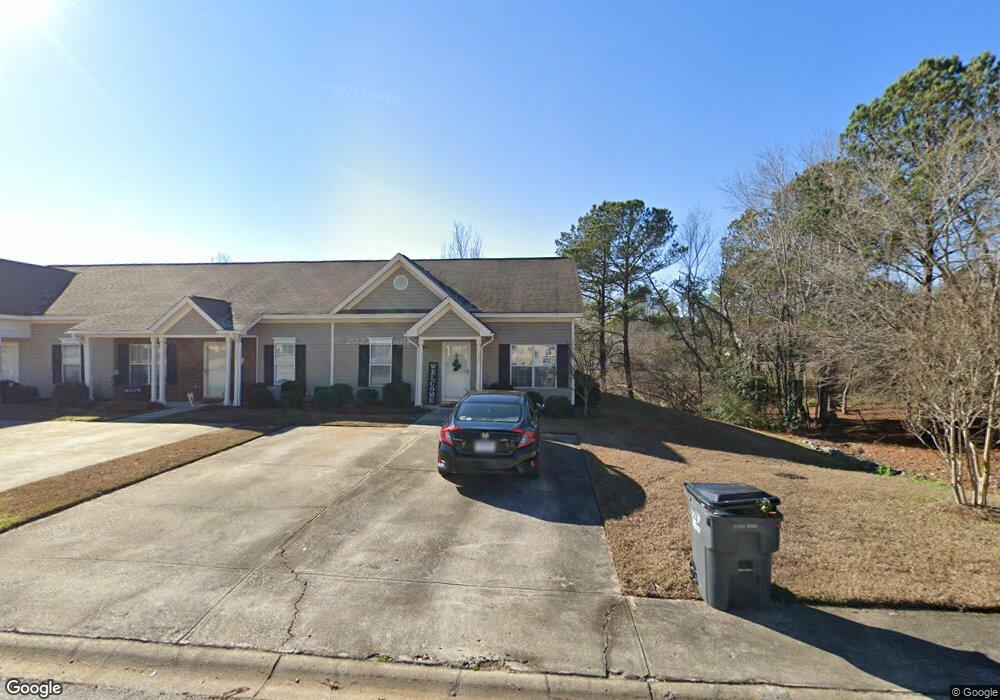
123 Haynesworth Place Lexington, SC 29072
Estimated Value: $180,000 - $196,007
2
Beds
2
Baths
1,120
Sq Ft
$167/Sq Ft
Est. Value
About This Home
This home is located at 123 Haynesworth Place, Lexington, SC 29072 and is currently estimated at $187,002, approximately $166 per square foot. 123 Haynesworth Place is a home located in Lexington County with nearby schools including Lexington Elementary School, Pleasant Hill Middle School, and Lexington High School.
Ownership History
Date
Name
Owned For
Owner Type
Purchase Details
Closed on
Jan 15, 2021
Sold by
Duffie Pamela N and Shumaker Pamela Duffie
Bought by
Wiley Kelly
Current Estimated Value
Home Financials for this Owner
Home Financials are based on the most recent Mortgage that was taken out on this home.
Original Mortgage
$119,790
Outstanding Balance
$106,913
Interest Rate
2.71%
Mortgage Type
FHA
Estimated Equity
$80,089
Purchase Details
Closed on
Aug 11, 2010
Sold by
Dill Susan L and Brown Susan L
Bought by
Duffie Pamela N
Home Financials for this Owner
Home Financials are based on the most recent Mortgage that was taken out on this home.
Original Mortgage
$95,950
Interest Rate
4.61%
Mortgage Type
Future Advance Clause Open End Mortgage
Purchase Details
Closed on
Mar 2, 2005
Sold by
Peterson Paul V and Peterson Deborah E
Bought by
Dill Susan L
Home Financials for this Owner
Home Financials are based on the most recent Mortgage that was taken out on this home.
Original Mortgage
$80,000
Interest Rate
5.61%
Mortgage Type
Future Advance Clause Open End Mortgage
Create a Home Valuation Report for This Property
The Home Valuation Report is an in-depth analysis detailing your home's value as well as a comparison with similar homes in the area
Home Values in the Area
Average Home Value in this Area
Purchase History
| Date | Buyer | Sale Price | Title Company |
|---|---|---|---|
| Wiley Kelly | $122,000 | None Available | |
| Duffie Pamela N | $101,000 | -- | |
| Dill Susan L | $100,000 | -- |
Source: Public Records
Mortgage History
| Date | Status | Borrower | Loan Amount |
|---|---|---|---|
| Open | Wiley Kelly | $119,790 | |
| Previous Owner | Duffie Pamela N | $95,950 | |
| Previous Owner | Dill Susan L | $80,000 |
Source: Public Records
Tax History Compared to Growth
Tax History
| Year | Tax Paid | Tax Assessment Tax Assessment Total Assessment is a certain percentage of the fair market value that is determined by local assessors to be the total taxable value of land and additions on the property. | Land | Improvement |
|---|---|---|---|---|
| 2024 | $856 | $4,880 | $792 | $4,088 |
| 2023 | $856 | $4,880 | $792 | $4,088 |
| 2022 | $854 | $4,880 | $792 | $4,088 |
| 2020 | $704 | $3,943 | $792 | $3,151 |
| 2019 | $729 | $3,836 | $792 | $3,044 |
| 2018 | $718 | $3,836 | $792 | $3,044 |
| 2017 | $700 | $3,836 | $792 | $3,044 |
| 2016 | $695 | $3,836 | $792 | $3,044 |
| 2014 | $709 | $4,039 | $720 | $3,319 |
| 2013 | -- | $4,040 | $720 | $3,320 |
Source: Public Records
Map
Nearby Homes
- 121 Roberts St
- 105 Gibson Forest Dr
- 352 Gibson Rd
- 420 S Church St
- 334 3rd Ave
- 2 Gibson Rd
- 127 Brooklet Dr
- 156 Whisper Lake Dr
- 310 S Lake Dr Unit 24B
- 308 S Lake Dr Unit 24A
- 302 S Lake Dr
- 108 Stuart Ln
- 284 S Lake Dr Unit 22A
- 210 Hendrix St
- 278 S Lake Dr Unit 20B
- 282 S Lake Dr Unit 21B
- 280 S Lake Dr Unit 21A
- 334 S Lake Dr
- 318 S Lake Dr
- 203 Meetze Ave
- 121 Haynesworth Place
- 119 Haynesworth Place
- 115 Haynesworth Place
- 103 Wood Ride Ln
- 124 Haynesworth Place
- 122 Haynesworth Place
- 105 Wood Ride Ln
- 126 Haynesworth Place
- 113 Haynesworth Place
- 118 Haynesworth Place
- 109 Wood Ride Ln
- 128 Haynesworth Place
- 116 Haynesworth Place
- 130 Haynesworth Place
- 111 Wood Ride Ln
- 111 Haynesworth Place
- 114 Haynesworth Place
- 127 Luden Ct
- 125 Luden Ct
- 112 Haynesworth Place