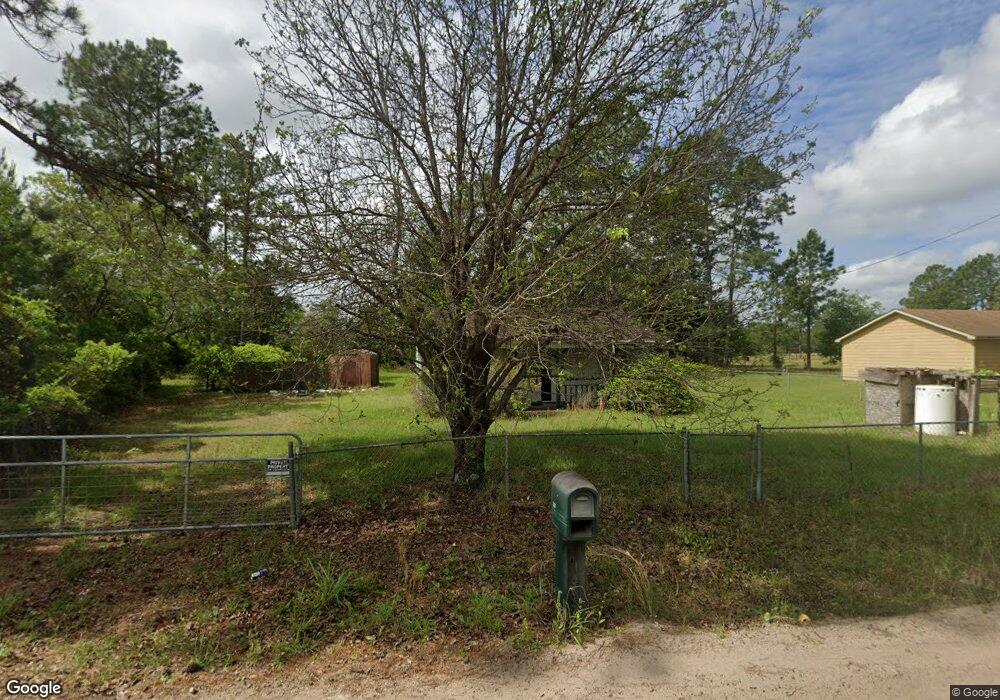
123 Henry Lee Bailey Rd Folkston, GA 31537
Estimated Value: $74,935 - $169,000
2
Beds
2
Baths
768
Sq Ft
$144/Sq Ft
Est. Value
About This Home
This home is located at 123 Henry Lee Bailey Rd, Folkston, GA 31537 and is currently estimated at $110,484, approximately $143 per square foot. 123 Henry Lee Bailey Rd is a home located in Charlton County with nearby schools including Charlton County High School and Charlton Christian Academy.
Ownership History
Date
Name
Owned For
Owner Type
Purchase Details
Closed on
Jul 21, 2023
Sold by
Sugrue Ida
Bought by
Kabasakalian Adam
Current Estimated Value
Purchase Details
Closed on
Dec 21, 2005
Sold by
Satilla Communtiy Bank
Bought by
Sugrue Benjamin L
Purchase Details
Closed on
May 20, 2005
Sold by
Satilla Community Bank
Bought by
Segrue Benjamin L and Segrue Ida
Purchase Details
Closed on
May 18, 2005
Sold by
Satilla Community Bank
Bought by
Segrue Benjamin L and Segrue Ida
Purchase Details
Closed on
Jun 24, 2004
Sold by
Moring Jerry L
Bought by
Satilla Communtiy Bank
Purchase Details
Closed on
Mar 24, 1997
Bought by
Moring Jerry L
Purchase Details
Closed on
Nov 1, 1995
Bought by
Meristem Inc
Purchase Details
Closed on
Aug 31, 1992
Bought by
Carver Mary L
Purchase Details
Closed on
Apr 22, 1991
Bought by
Southeastern Bank
Create a Home Valuation Report for This Property
The Home Valuation Report is an in-depth analysis detailing your home's value as well as a comparison with similar homes in the area
Home Values in the Area
Average Home Value in this Area
Purchase History
| Date | Buyer | Sale Price | Title Company |
|---|---|---|---|
| Kabasakalian Adam | $40,000 | -- | |
| Sugrue Benjamin L | $34,000 | -- | |
| Segrue Benjamin L | $34,000 | -- | |
| Segrue Benjamin L | $34,000 | -- | |
| Satilla Communtiy Bank | -- | -- | |
| Moring Jerry L | $31,500 | -- | |
| Meristem Inc | $15,000 | -- | |
| Carver Mary L | $32,000 | -- | |
| Southeastern Bank | -- | -- |
Source: Public Records
Tax History Compared to Growth
Tax History
| Year | Tax Paid | Tax Assessment Tax Assessment Total Assessment is a certain percentage of the fair market value that is determined by local assessors to be the total taxable value of land and additions on the property. | Land | Improvement |
|---|---|---|---|---|
| 2024 | $960 | $31,140 | $1,040 | $30,100 |
| 2023 | $538 | $16,220 | $960 | $15,260 |
| 2022 | $477 | $13,140 | $920 | $12,220 |
| 2021 | $596 | $13,792 | $920 | $12,872 |
| 2020 | $491 | $13,792 | $920 | $12,872 |
| 2019 | $582 | $13,400 | $920 | $12,480 |
| 2018 | $601 | $13,760 | $1,280 | $12,480 |
| 2017 | $473 | $12,960 | $1,280 | $11,680 |
| 2016 | $542 | $12,960 | $1,280 | $11,680 |
| 2015 | -- | $12,960 | $1,280 | $11,680 |
| 2014 | -- | $12,960 | $1,280 | $11,680 |
| 2013 | -- | $12,960 | $1,280 | $11,680 |
Source: Public Records
Map
Nearby Homes
- 120 John H Carter III Ln
- 201 Colonial Way
- 3204 Route 1
- 892 Reynolds Rd
- 0 Passieu Cir Unit 20171701
- 1654 (LOT 43) Spring Lake
- 1654 (LOT 42) Spring Lake Dr Unit 42
- 1654 (LOT 44) Spring Lake Dr Unit 44
- 0 (LOT 4) Dogwood Ln Unit LOT 4
- 0 (LOT 3) Dogwood Ln Unit LOT 3
- 0(LOT 2) Dogwood Ln Unit LOT 2
- 0 (LOT 5) Dogwood Ln Unit LOT 5
- 0 (LOT 6) Dogwood Ln
- 242 Pinehurst Dr
- 190 Forest Lake Dr
- 125 Kingsland Dr
- 13 Dallas Cir
- 477 Dallas Cir
- 195 Fern Dr
- 564 Dallas Cir
- 145 Henry Lee Bailey Rd
- 173 Henry Lee Bailey Rd
- 61 Henry Lee Bailey Rd
- 166 Henry Lee Bailey Rd
- 217 Henry Lee Bailey Rd
- 1243 Highway 252
- 1257 Highway 252
- 258 Henry Lee Bailey Rd
- 0 Burnt Fort Rd Sr 252 Unit 1579836
- 75 Rufus Edwards Rd
- 5 Smith Moring Rd
- 88 Rufus Edwards Rd
- 178 Rufus Edwards Rd
- 0 Hwy 252 Unit 3152766
- 0 Hwy 252 Unit 37AC 7360201
- 1332 Highway 252
- 263 Prescott Rd
- 35 Smith Moring Rd
- 0 Prescott Rd
- 1020 Martin Luther King jr Dr