123 Heron Dr Kathleen, GA 31047
Estimated Value: $511,710 - $697,000
5
Beds
5
Baths
3,541
Sq Ft
$166/Sq Ft
Est. Value
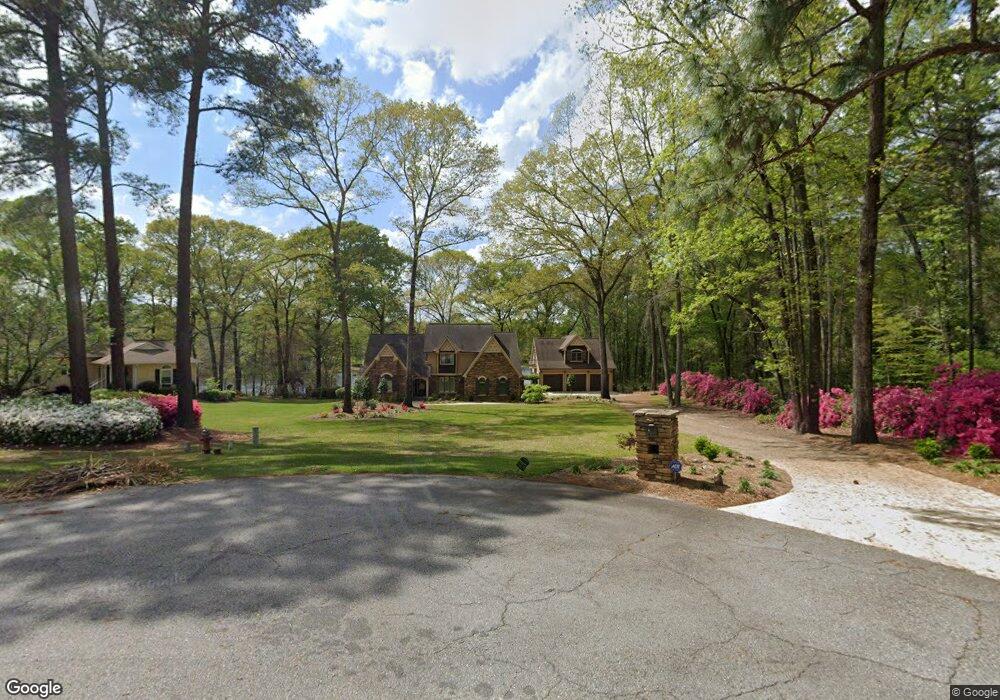
About This Home
This home is located at 123 Heron Dr, Kathleen, GA 31047 and is currently estimated at $589,178, approximately $166 per square foot. 123 Heron Dr is a home located in Houston County with nearby schools including Hilltop Elementary School, Bonaire Middle School, and Veterans High School.
Ownership History
Date
Name
Owned For
Owner Type
Purchase Details
Closed on
Dec 23, 2008
Sold by
Baggett Kevin J
Bought by
Baggett Kevin J and Baggett Christie E
Current Estimated Value
Home Financials for this Owner
Home Financials are based on the most recent Mortgage that was taken out on this home.
Original Mortgage
$236,000
Outstanding Balance
$154,635
Interest Rate
5.96%
Mortgage Type
Stand Alone Refi Refinance Of Original Loan
Estimated Equity
$434,543
Purchase Details
Closed on
May 28, 2004
Sold by
Bowen Edward W and Bowen Melinda M
Bought by
Baggett Kevin J
Purchase Details
Closed on
Mar 25, 2000
Sold by
Bowen Edward W
Bought by
Bowen Edward W and Bowen Melinda M
Purchase Details
Closed on
Jul 29, 1998
Sold by
Bowen Edward W and Bowen Sally T
Bought by
Bowen Edward W
Purchase Details
Closed on
Jan 22, 1988
Sold by
Smith Bobby Lee
Bought by
Bowen Edward W and Bowen Sally T
Create a Home Valuation Report for This Property
The Home Valuation Report is an in-depth analysis detailing your home's value as well as a comparison with similar homes in the area
Home Values in the Area
Average Home Value in this Area
Purchase History
| Date | Buyer | Sale Price | Title Company |
|---|---|---|---|
| Baggett Kevin J | -- | None Available | |
| Baggett Kevin J | $305,000 | -- | |
| Bowen Edward W | $10,000 | -- | |
| Bowen Edward W | -- | -- | |
| Bowen Edward W | $27,500 | -- |
Source: Public Records
Mortgage History
| Date | Status | Borrower | Loan Amount |
|---|---|---|---|
| Open | Baggett Kevin J | $236,000 |
Source: Public Records
Tax History Compared to Growth
Tax History
| Year | Tax Paid | Tax Assessment Tax Assessment Total Assessment is a certain percentage of the fair market value that is determined by local assessors to be the total taxable value of land and additions on the property. | Land | Improvement |
|---|---|---|---|---|
| 2024 | $4,174 | $176,480 | $25,920 | $150,560 |
| 2023 | $3,572 | $149,800 | $25,920 | $123,880 |
| 2022 | $3,418 | $143,400 | $25,920 | $117,480 |
| 2021 | $3,196 | $133,560 | $25,920 | $107,640 |
| 2020 | $3,124 | $130,000 | $25,920 | $104,080 |
| 2019 | $3,124 | $130,000 | $25,920 | $104,080 |
| 2018 | $3,124 | $130,000 | $25,920 | $104,080 |
| 2017 | $3,127 | $130,000 | $25,920 | $104,080 |
| 2016 | $3,132 | $130,000 | $25,920 | $104,080 |
| 2015 | $3,139 | $130,000 | $25,920 | $104,080 |
| 2014 | -- | $130,000 | $25,920 | $104,080 |
| 2013 | -- | $132,760 | $25,920 | $106,840 |
Source: Public Records
Map
Nearby Homes