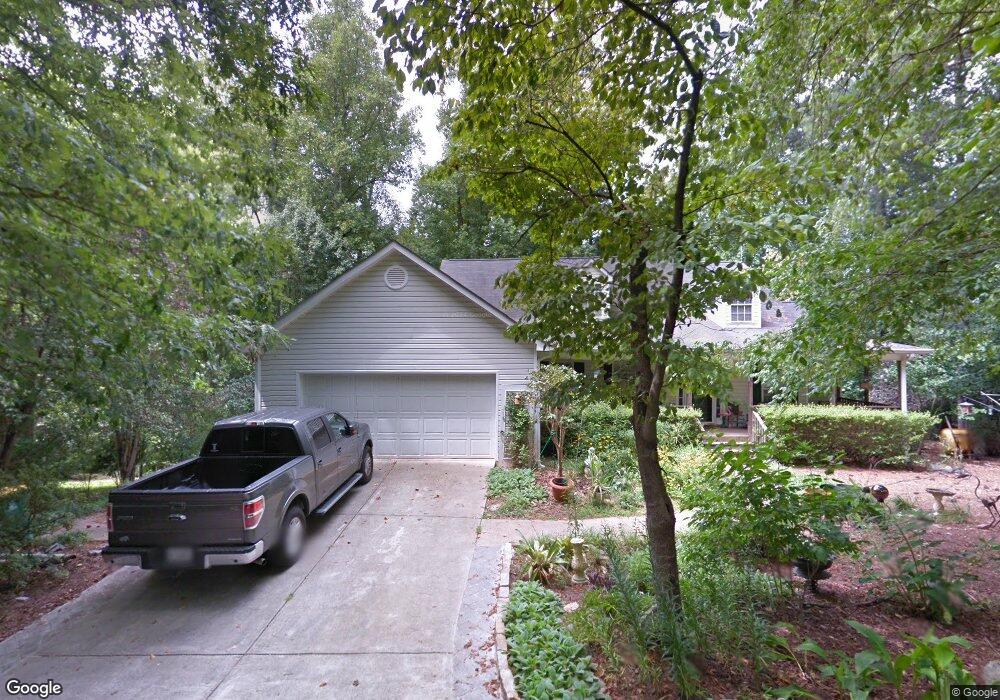
123 Hickory St Roswell, GA 30075
Estimated Value: $640,000 - $729,000
4
Beds
3
Baths
2,225
Sq Ft
$308/Sq Ft
Est. Value
About This Home
This home is located at 123 Hickory St, Roswell, GA 30075 and is currently estimated at $686,160, approximately $308 per square foot. 123 Hickory St is a home located in Fulton County with nearby schools including Mountain Park Elementary School, Crabapple Middle School, and Roswell High School.
Ownership History
Date
Name
Owned For
Owner Type
Purchase Details
Closed on
Aug 25, 2022
Sold by
Broadway Timothy
Bought by
Timothy And Sarah Broadway Rev Tr
Current Estimated Value
Purchase Details
Closed on
Feb 17, 2017
Sold by
Broadway Timothy
Bought by
Rice John
Home Financials for this Owner
Home Financials are based on the most recent Mortgage that was taken out on this home.
Original Mortgage
$240,000
Interest Rate
4.09%
Mortgage Type
New Conventional
Purchase Details
Closed on
Dec 30, 2010
Sold by
Pierce Robert D
Bought by
Broadway Timothy and Broadway Sarah
Home Financials for this Owner
Home Financials are based on the most recent Mortgage that was taken out on this home.
Original Mortgage
$208,000
Interest Rate
4.42%
Mortgage Type
New Conventional
Create a Home Valuation Report for This Property
The Home Valuation Report is an in-depth analysis detailing your home's value as well as a comparison with similar homes in the area
Home Values in the Area
Average Home Value in this Area
Purchase History
| Date | Buyer | Sale Price | Title Company |
|---|---|---|---|
| Timothy And Sarah Broadway Rev Tr | -- | -- | |
| Rice John | $20,000 | -- | |
| Broadway Timothy | $262,000 | -- |
Source: Public Records
Mortgage History
| Date | Status | Borrower | Loan Amount |
|---|---|---|---|
| Previous Owner | Rice John | $240,000 | |
| Previous Owner | Broadway Timothy | $208,000 |
Source: Public Records
Tax History Compared to Growth
Tax History
| Year | Tax Paid | Tax Assessment Tax Assessment Total Assessment is a certain percentage of the fair market value that is determined by local assessors to be the total taxable value of land and additions on the property. | Land | Improvement |
|---|---|---|---|---|
| 2025 | $7,838 | $269,160 | $53,920 | $215,240 |
| 2023 | $7,186 | $254,600 | $46,040 | $208,560 |
| 2022 | $5,487 | $246,400 | $29,480 | $216,920 |
| 2021 | $5,249 | $180,400 | $28,760 | $151,640 |
| 2020 | $5,326 | $160,120 | $23,960 | $136,160 |
| 2019 | $5,267 | $157,280 | $23,520 | $133,760 |
| 2018 | $4,780 | $141,040 | $21,960 | $119,080 |
| 2017 | $3,343 | $89,000 | $13,520 | $75,480 |
| 2016 | $3,343 | $89,000 | $13,520 | $75,480 |
| 2015 | $3,379 | $89,000 | $13,520 | $75,480 |
| 2014 | $3,374 | $86,800 | $13,520 | $73,280 |
Source: Public Records
Map
Nearby Homes
- 125 Hickory St
- 202 Oak St
- 505 Oak St Unit IVEY
- 114 Hickory St
- 208 Oak St
- 106 Elm St
- 124 Hickory St
- 0 Oak St Unit 3223814
- 0 Oak St
- 0 Elm St Unit 7266689
- 0 Elm St Unit 9011207
- 0 Elm St Unit 7066564
- 0 Elm St Unit 8626916
- 0 Elm St Unit 8522816
- 214 Oak St
- 110 Hickory St
- 105 Hickory St
- 0 Hickory St Unit 7117881
- 0 Hickory St Unit 8055761
- 211 Oak St