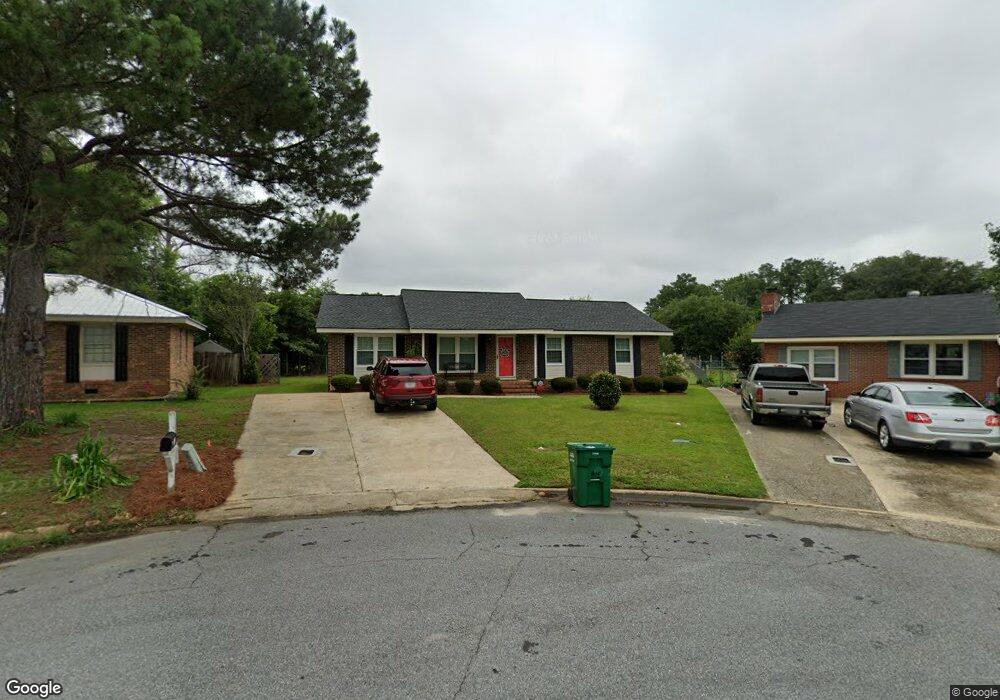
123 Jefferson Ct Leesburg, GA 31763
Estimated Value: $164,000 - $254,000
4
Beds
3
Baths
1,834
Sq Ft
$110/Sq Ft
Est. Value
About This Home
This home is located at 123 Jefferson Ct, Leesburg, GA 31763 and is currently estimated at $202,333, approximately $110 per square foot. 123 Jefferson Ct is a home located in Lee County with nearby schools including Lee County Primary School, Lee County Elementary School, and Lee County Middle School - West Campus.
Ownership History
Date
Name
Owned For
Owner Type
Purchase Details
Closed on
May 10, 2022
Sold by
Hendrix David
Bought by
Hendrix Matthew Scott
Current Estimated Value
Purchase Details
Closed on
May 9, 2011
Sold by
Secretary Of Housing & Urban Development
Bought by
Hendrix David
Purchase Details
Closed on
Jun 1, 2010
Sold by
Robinson Dawn and Robinson Alfreda
Bought by
Bac Home Loans Servicing Lp
Purchase Details
Closed on
Mar 30, 2007
Sold by
American General Financial
Bought by
Robinson Dawn and Robinson Alfreda
Home Financials for this Owner
Home Financials are based on the most recent Mortgage that was taken out on this home.
Original Mortgage
$107,315
Interest Rate
6.15%
Mortgage Type
FHA
Purchase Details
Closed on
Oct 3, 2006
Sold by
Fisher Jami L
Bought by
American General Financial Svc
Purchase Details
Closed on
Nov 1, 1999
Sold by
Nason Bandi Lynn
Bought by
Fisher Howard J
Purchase Details
Closed on
Jun 1, 1998
Sold by
Nason Cecil
Bought by
Nason Bandi Lynn
Create a Home Valuation Report for This Property
The Home Valuation Report is an in-depth analysis detailing your home's value as well as a comparison with similar homes in the area
Home Values in the Area
Average Home Value in this Area
Purchase History
| Date | Buyer | Sale Price | Title Company |
|---|---|---|---|
| Hendrix Matthew Scott | -- | -- | |
| Hendrix David | $55,200 | -- | |
| Bac Home Loans Servicing Lp | $133,100 | -- | |
| Bac Home Loans Servicing Lp | $133,067 | -- | |
| Robinson Dawn | $109,000 | -- | |
| American General Financial Svc | $23,700 | -- | |
| Fisher Howard J | $82,000 | -- | |
| Nason Bandi Lynn | -- | -- |
Source: Public Records
Mortgage History
| Date | Status | Borrower | Loan Amount |
|---|---|---|---|
| Previous Owner | Robinson Dawn | $107,315 |
Source: Public Records
Tax History Compared to Growth
Tax History
| Year | Tax Paid | Tax Assessment Tax Assessment Total Assessment is a certain percentage of the fair market value that is determined by local assessors to be the total taxable value of land and additions on the property. | Land | Improvement |
|---|---|---|---|---|
| 2024 | $1,484 | $49,116 | $6,000 | $43,116 |
| 2023 | $1,384 | $49,116 | $6,000 | $43,116 |
| 2022 | $1,384 | $49,116 | $6,000 | $43,116 |
| 2021 | $1,387 | $49,116 | $6,000 | $43,116 |
| 2020 | $1,135 | $34,280 | $6,000 | $28,280 |
| 2019 | $1,155 | $34,280 | $6,000 | $28,280 |
| 2018 | $1,155 | $34,280 | $6,000 | $28,280 |
| 2017 | $1,094 | $34,280 | $6,000 | $28,280 |
| 2016 | $1,094 | $34,280 | $6,000 | $28,280 |
| 2015 | $1,100 | $34,280 | $6,000 | $28,280 |
| 2014 | $1,104 | $34,280 | $6,000 | $28,280 |
| 2013 | -- | $34,280 | $6,000 | $28,280 |
Source: Public Records
Map
Nearby Homes
- 116 Saxton Place
- 206 Saxton Place
- 211 Saxton Place
- 110 Saxton Place
- 147 Lynwood Ln
- 125 Tabatha St
- 111 Chapel Ct
- 235 Cedric St
- 238 Kinchafoonee Creek Rd
- 263 Mayfield Dr
- 167 Jarrett Dr
- 124 Tuskin Oaks Ct
- 156 Old Hickory Dr
- 161 Old Hickory Dr
- 131 Maggie Ct
- 529 Creekside Dr
- 127 Mcintosh Rd
- 164 Canuga Dr
- 142 Cuaneta Dr
- 153 Canuga Dr
- 125 Jefferson Ct
- 121 Jefferson Ct
- 119 Jefferson Ct
- 124 Jefferson Ct
- 102 Pelham Dr
- 102 Pelham Dr Unit 123
- 100 Pelham Dr
- 122 Jefferson Ct
- 120 Jefferson Ct
- 117 Jefferson Ct
- 118 Jefferson Ct
- 104 Pelham Dr
- 113 Jefferson Ct
- 116 Jefferson Ct
- 127 Lee Dr
- 123 Lee Dr
- 129 Lee Dr
- 101 Pelham Dr
- 121 Lee Dr
- 111 Jefferson Ct