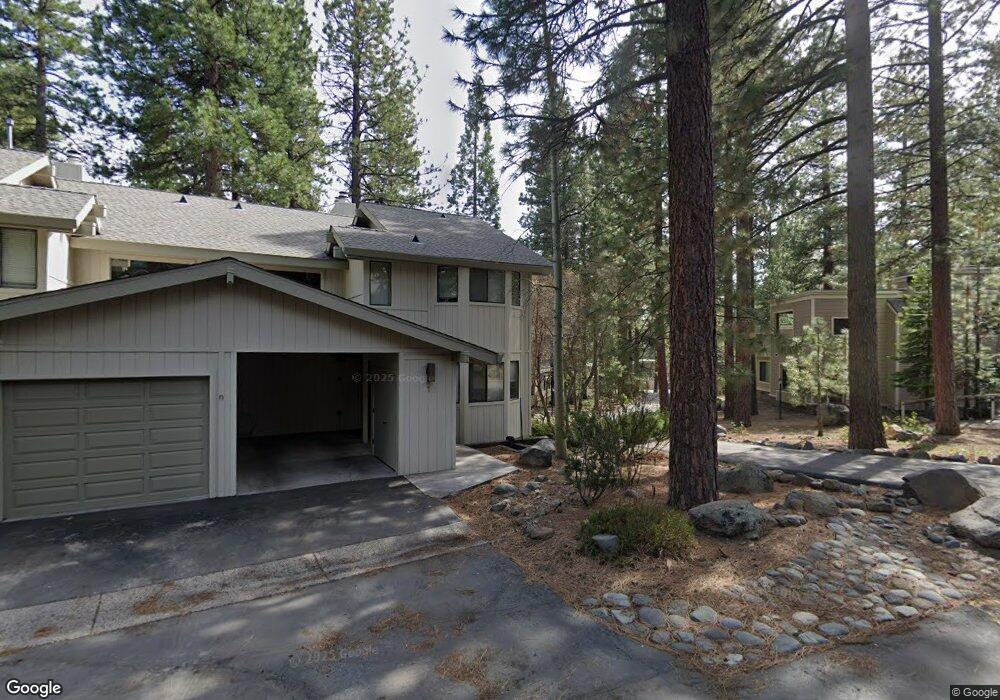
123 Juanita Dr Unit 10 Incline Village, NV 89451
Estimated Value: $1,054,000 - $1,220,000
3
Beds
2
Baths
1,329
Sq Ft
$847/Sq Ft
Est. Value
About This Home
This home is located at 123 Juanita Dr Unit 10, Incline Village, NV 89451 and is currently estimated at $1,126,299, approximately $847 per square foot. 123 Juanita Dr Unit 10 is a home located in Washoe County with nearby schools including Incline Elementary School, Incline Middle School, and Incline High School.
Ownership History
Date
Name
Owned For
Owner Type
Purchase Details
Closed on
May 26, 2015
Sold by
Novelli Richard D and Novelli Carol T
Bought by
R & C Family Lp
Current Estimated Value
Purchase Details
Closed on
Jun 16, 2009
Sold by
Novelli Richard D and Novelli Carol T
Bought by
The R & C Family Limited Partnership
Purchase Details
Closed on
Sep 17, 2004
Sold by
Bhargavan K
Bought by
Novelli Richard D and Novelli Carol T
Purchase Details
Closed on
Aug 22, 2001
Sold by
Merolla R
Bought by
Bhargavan K and Bhargavan J
Purchase Details
Closed on
Jul 3, 2000
Sold by
Chard Robert F and Chard Audrey M
Bought by
Merolla R and Merolla Bhargavan K
Purchase Details
Closed on
Jun 21, 2000
Sold by
Barth Scott
Bought by
Barth Jennifer Chard
Purchase Details
Closed on
Nov 15, 1993
Sold by
Chard Robert F and Chard Audrey M
Bought by
Chard Robert F and Chard Audrey M
Create a Home Valuation Report for This Property
The Home Valuation Report is an in-depth analysis detailing your home's value as well as a comparison with similar homes in the area
Home Values in the Area
Average Home Value in this Area
Purchase History
| Date | Buyer | Sale Price | Title Company |
|---|---|---|---|
| R & C Family Lp | -- | Accommodation | |
| The R & C Family Limited Partnership | -- | None Available | |
| Novelli Richard D | $515,000 | Western Title Incorporated | |
| Bhargavan K | $155,000 | Stewart Title Northern Nevad | |
| Merolla R | $305,000 | Founders Title Co | |
| Barth Jennifer Chard | -- | Founders Title Co | |
| Chard Robert F | -- | -- |
Source: Public Records
Tax History Compared to Growth
Tax History
| Year | Tax Paid | Tax Assessment Tax Assessment Total Assessment is a certain percentage of the fair market value that is determined by local assessors to be the total taxable value of land and additions on the property. | Land | Improvement |
|---|---|---|---|---|
| 2025 | $2,319 | $126,127 | $102,165 | $23,962 |
| 2024 | $2,319 | $111,471 | $87,150 | $24,321 |
| 2023 | $2,271 | $113,668 | $92,610 | $21,058 |
| 2022 | $2,543 | $88,768 | $69,825 | $18,943 |
| 2021 | $2,492 | $60,874 | $42,525 | $18,349 |
| 2020 | $2,490 | $60,423 | $41,510 | $18,913 |
| 2019 | $2,442 | $54,403 | $35,385 | $19,018 |
| 2018 | $2,395 | $48,220 | $29,225 | $18,995 |
| 2017 | $2,349 | $45,236 | $25,935 | $19,301 |
| 2016 | $2,311 | $43,092 | $23,065 | $20,027 |
| 2015 | $2,307 | $45,537 | $25,865 | $19,672 |
| 2014 | $2,264 | $41,638 | $21,735 | $19,903 |
| 2013 | -- | $41,228 | $21,280 | $19,948 |
Source: Public Records
Map
Nearby Homes
- 123 Juanita Dr Unit 5
- 123 Juanita Dr Unit 1-29
- 123 Juanita Dr Unit 1-19
- 123 Juanita Dr Unit 17
- 123 Juanita Dr Unit 7
- 123 Juanita Dr Unit 2
- 121 Juanita Dr Unit 2-31
- 121 Juanita Dr Unit 2-36
- 136 Juanita Dr Unit 53
- 136 Juanita Dr Unit 47
- 150 Juanita Dr Unit 2
- 170 Village Blvd Unit 4
- 855 Ophir Peak Rd
- 866 Southwood Blvd
- 144 Village Blvd Unit 96
- 144 Village Blvd Unit 35
- 144 Village Blvd Unit 51
- 931 Incline Way Unit 249
- 939 Incline Way Unit 195
- 915 Incline Way Unit 203
- 123 Juanita Dr Unit 1-2
- 123 Juanita Dr Unit 1-1
- 123 Juanita Dr Unit 16
- 123 Juanita Dr Unit 9
- 123 Juanita Dr Unit 1-4
- 123 Juanita Dr Unit 1-3
- 123 Juanita Dr
- 123 Juanita Dr
- 123 Juanita Dr Unit 23
- 123 Juanita Dr Unit 29
- 123 Juanita Dr Unit 2-2
- 123 Juanita Dr Unit 28
- 123 Juanita Dr
- 123 Juanita Dr Unit 27
- 123 Juanita Dr
- 123 Juanita Dr Unit 19
- 123 Juanita Dr Unit 26
- 123 Juanita Dr Unit 2-5
- 123 Juanita Dr Unit 34
- 123 Juanita Dr