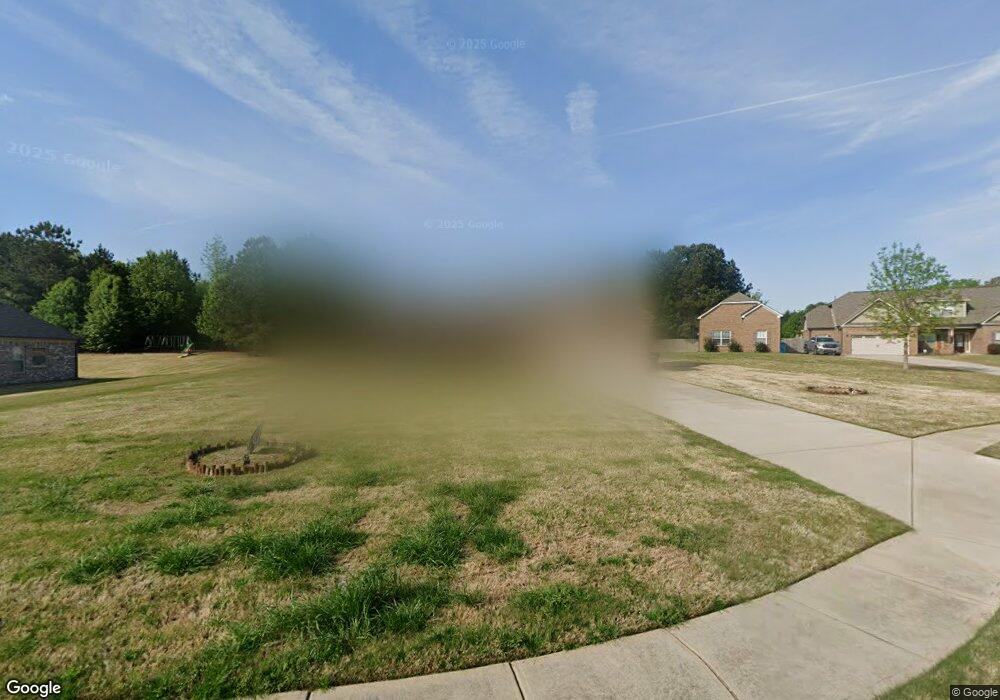
123 Kayla Ct Unit 6 Locust Grove, GA 30248
Estimated Value: $390,092 - $448,000
4
Beds
3
Baths
2,445
Sq Ft
$174/Sq Ft
Est. Value
About This Home
This home is located at 123 Kayla Ct Unit 6, Locust Grove, GA 30248 and is currently estimated at $424,773, approximately $173 per square foot. 123 Kayla Ct Unit 6 is a home located in Henry County with nearby schools including Unity Grove Elementary School, Locust Grove Middle School, and Locust Grove High School.
Ownership History
Date
Name
Owned For
Owner Type
Purchase Details
Closed on
Oct 13, 2020
Sold by
Harville Levi
Bought by
Dickson Lorrie
Current Estimated Value
Home Financials for this Owner
Home Financials are based on the most recent Mortgage that was taken out on this home.
Original Mortgage
$280,623
Outstanding Balance
$247,676
Interest Rate
2.8%
Mortgage Type
FHA
Estimated Equity
$177,097
Purchase Details
Closed on
Jun 21, 2019
Sold by
Agan Ricky C
Bought by
Harville Levi and Harville Shali
Home Financials for this Owner
Home Financials are based on the most recent Mortgage that was taken out on this home.
Original Mortgage
$234,025
Interest Rate
4.4%
Mortgage Type
FHA
Purchase Details
Closed on
Jun 17, 2016
Sold by
Capshaw Development Co Llc
Bought by
Agan Ricky C
Home Financials for this Owner
Home Financials are based on the most recent Mortgage that was taken out on this home.
Original Mortgage
$218,846
Interest Rate
3.58%
Mortgage Type
New Conventional
Purchase Details
Closed on
Oct 9, 2015
Sold by
Lrn Homes Llc
Bought by
Capshaw Development Co Llc
Create a Home Valuation Report for This Property
The Home Valuation Report is an in-depth analysis detailing your home's value as well as a comparison with similar homes in the area
Home Values in the Area
Average Home Value in this Area
Purchase History
| Date | Buyer | Sale Price | Title Company |
|---|---|---|---|
| Dickson Lorrie | $285,000 | -- | |
| Harville Levi | $245,000 | -- | |
| Agan Ricky C | $230,365 | -- | |
| Capshaw Development Co Llc | $74,000 | -- | |
| Lrn Homes Llc | $30,000 | -- |
Source: Public Records
Mortgage History
| Date | Status | Borrower | Loan Amount |
|---|---|---|---|
| Open | Dickson Lorrie | $280,623 | |
| Previous Owner | Harville Levi | $234,025 | |
| Previous Owner | Agan Ricky C | $218,846 |
Source: Public Records
Tax History Compared to Growth
Tax History
| Year | Tax Paid | Tax Assessment Tax Assessment Total Assessment is a certain percentage of the fair market value that is determined by local assessors to be the total taxable value of land and additions on the property. | Land | Improvement |
|---|---|---|---|---|
| 2025 | $7,124 | $178,240 | $22,000 | $156,240 |
| 2024 | $7,124 | $162,320 | $22,000 | $140,320 |
| 2023 | $6,132 | $157,840 | $18,000 | $139,840 |
| 2022 | $5,247 | $134,760 | $18,000 | $116,760 |
| 2021 | $4,389 | $112,400 | $18,000 | $94,400 |
| 2020 | $3,837 | $98,000 | $13,916 | $84,084 |
| 2019 | $4,039 | $103,280 | $14,600 | $88,680 |
| 2018 | $3,828 | $97,760 | $14,600 | $83,160 |
| 2016 | $605 | $14,800 | $14,800 | $0 |
| 2015 | -- | $12,000 | $12,000 | $0 |
| 2014 | $174 | $4,000 | $4,000 | $0 |
Source: Public Records
Map
Nearby Homes
- 943 Colvin Dr
- 735 Strawflower Ln
- 328 Trulove Ln Unit 32
- 316 Trulove Ln Unit 35
- 104 Waratah Dr
- 300 Leguin Mill Rd
- 1145 Larkspur Dr
- 825 S Bethany Rd
- 1404 Saddlebrook Ct
- 230 Leguin Mill Rd
- 678 Seabolt Rd
- 551 Rosalind Terrace
- 305 Annie Ln Unit 2
- 165 Leguin Mill Rd
- 705 Seabolt Rd
- 75 Price Dr W
- 604 Onieda Dr
- 959 Gettysburg Way
- 3026 Ryan Rd
- 703 Paul Revere Dr
- 123 Kayla Ct
- 117 Kayla Ct
- 125 Kayla Ct
- 131 Kayla Ct
- 109 Kayla Unit 3
- 109 Kayla
- 997 Colvin Dr
- 118 Kayla
- 122 Kayla
- 170 Harris Dr
- 114 Kayla Ct Unit 13
- 130 Kayla Ct
- 957 Colvin Dr
- 110 Kayla Ct Unit 14
- 126 Kayla Ct
- 0 Kayla Ct Unit 8828987
- 0 Kayla Ct Unit 8619095
- 0 Kayla Ct Unit 8561939
- 0 Kayla Ct Unit 8006950
- 0 Kayla Ct