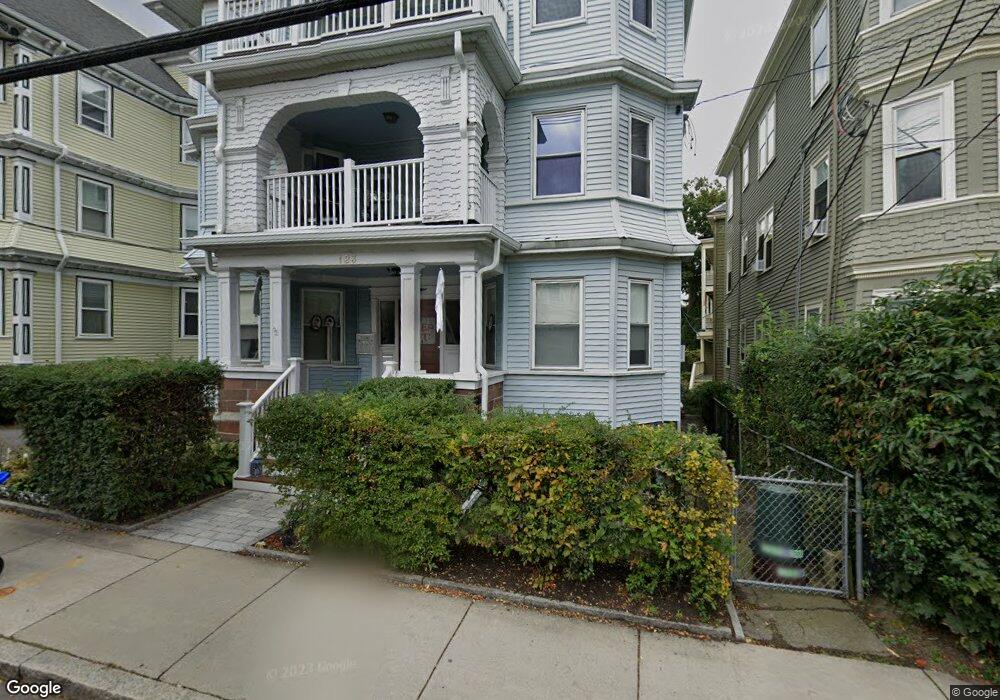
123 Kent St Brookline, MA 02445
Brookline Village NeighborhoodEstimated Value: $2,590,000 - $2,814,000
9
Beds
3
Baths
5,184
Sq Ft
$517/Sq Ft
Est. Value
About This Home
This home is located at 123 Kent St, Brookline, MA 02445 and is currently estimated at $2,678,000, approximately $516 per square foot. 123 Kent St is a home located in Norfolk County with nearby schools including Pierce School, St. Mary of the Assumption Elementary School, and Winsor School.
Ownership History
Date
Name
Owned For
Owner Type
Purchase Details
Closed on
Jan 25, 2005
Sold by
123 Kent Street Rlty L
Bought by
Pineo Charles F and Pineo Regina M
Current Estimated Value
Home Financials for this Owner
Home Financials are based on the most recent Mortgage that was taken out on this home.
Original Mortgage
$350,000
Outstanding Balance
$177,431
Interest Rate
5.71%
Mortgage Type
Purchase Money Mortgage
Estimated Equity
$2,500,569
Create a Home Valuation Report for This Property
The Home Valuation Report is an in-depth analysis detailing your home's value as well as a comparison with similar homes in the area
Home Values in the Area
Average Home Value in this Area
Purchase History
| Date | Buyer | Sale Price | Title Company |
|---|---|---|---|
| Pineo Charles F | -- | -- |
Source: Public Records
Mortgage History
| Date | Status | Borrower | Loan Amount |
|---|---|---|---|
| Open | Pineo Charles F | $350,000 |
Source: Public Records
Tax History Compared to Growth
Tax History
| Year | Tax Paid | Tax Assessment Tax Assessment Total Assessment is a certain percentage of the fair market value that is determined by local assessors to be the total taxable value of land and additions on the property. | Land | Improvement |
|---|---|---|---|---|
| 2025 | $27,334 | $2,769,400 | $1,168,800 | $1,600,600 |
| 2024 | $27,473 | $2,812,000 | $1,123,800 | $1,688,200 |
| 2023 | $26,110 | $2,618,900 | $1,033,500 | $1,585,400 |
| 2022 | $25,416 | $2,494,200 | $984,300 | $1,509,900 |
| 2021 | $23,502 | $2,398,200 | $946,400 | $1,451,800 |
| 2020 | $22,164 | $2,345,400 | $860,300 | $1,485,100 |
| 2019 | $23,917 | $2,552,500 | $819,400 | $1,733,100 |
| 2018 | $21,011 | $2,221,000 | $644,800 | $1,576,200 |
| 2017 | $20,318 | $2,056,500 | $608,300 | $1,448,200 |
| 2016 | $19,485 | $1,870,000 | $568,900 | $1,301,100 |
| 2015 | $17,683 | $1,655,700 | $487,400 | $1,168,300 |
| 2014 | $19,001 | $1,668,200 | $448,300 | $1,219,900 |
Source: Public Records
Map
Nearby Homes
- 216 Aspinwall Ave
- 214 Aspinwall Ave Unit 2
- 58 Kent St Unit 302
- 58 Kent St Unit 404
- 58 Kent St Unit 305
- 58 Kent St Unit 303
- 39 Kent St Unit B
- 14 Linden St Unit 8
- 390 Riverway Unit 24
- 106 Brook St
- 120 Brook St Unit 1
- 44 Washington St Unit 501
- 65 Francis St Unit 65
- 65 Francis St
- 820-824 Huntington Ave
- 6 Juniper St Unit 16
- 33 Pond Ave Unit 422
- 33 Pond Ave Unit 709
- 33 Pond Ave Unit 523
- 33 Pond Ave Unit 919
- 123 Kent St Unit 2
- 123 Kent St Unit 3
- 125 Kent St
- 117 Kent St Unit 1
- 117 Kent St Unit 3
- 117 Kent St Unit 2
- 117 Kent St Unit 2 $489,000-
- 131 Kent St
- 1 Brook St
- 1 Brook St Unit 3
- 1 Brook St Unit 1R
- 1 Brook St Unit 1L
- 1 Brook St Unit 2
- 1 Brook St
- 122 Kent St
- 128 Kent St
- 19 Brook St
- 233 Aspinwall Ave
- 233 Aspinwall Ave Unit 4
- 227 Aspinwall Ave