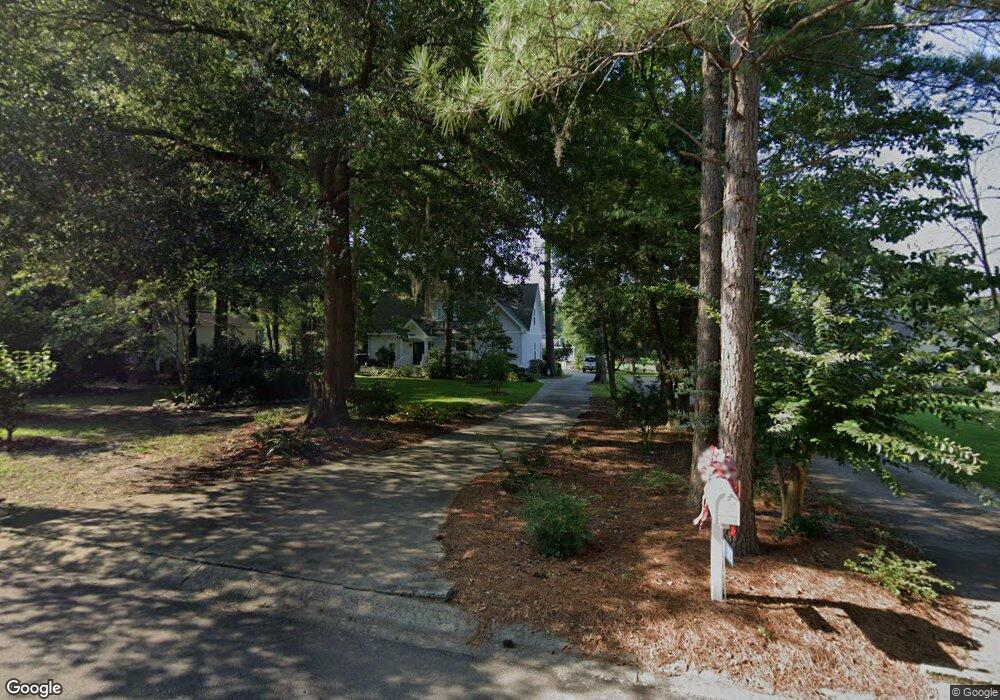
123 Lincolm Pinch Way Cordele, GA 31015
Estimated Value: $579,764 - $793,000
3
Beds
3
Baths
2,553
Sq Ft
$274/Sq Ft
Est. Value
About This Home
This home is located at 123 Lincolm Pinch Way, Cordele, GA 31015 and is currently estimated at $698,691, approximately $273 per square foot. 123 Lincolm Pinch Way is a home located in Crisp County with nearby schools including Crisp County Elementary School, Crisp County Primary School, and Crisp County Middle School.
Ownership History
Date
Name
Owned For
Owner Type
Purchase Details
Closed on
Nov 9, 2006
Sold by
Cromer Ray E
Bought by
Cromer Barbara B
Current Estimated Value
Purchase Details
Closed on
Nov 8, 2006
Sold by
Rodriguez Nelson J
Bought by
Cromer Ray E
Purchase Details
Closed on
May 1, 2003
Sold by
Smith David Wayne and Smith Lisa K
Bought by
Rodriquez Nelson J and Rodriquez Diana L
Purchase Details
Closed on
Sep 6, 2002
Sold by
Smith David Wayne and Smith Lisa K
Bought by
Rodriquez Nelson J and Rodriquez Diana L
Purchase Details
Closed on
Sep 27, 2000
Sold by
Regions Bank
Bought by
Richter Gregory
Purchase Details
Closed on
Sep 15, 2000
Sold by
Regions Bank
Bought by
Richter Gregory
Purchase Details
Closed on
Feb 21, 2000
Sold by
Folsom Sidney Rann
Bought by
Richter Gregory J
Purchase Details
Closed on
Jul 31, 1997
Sold by
Folsom Sidney Etal
Bought by
Folsom Sidney Rann
Create a Home Valuation Report for This Property
The Home Valuation Report is an in-depth analysis detailing your home's value as well as a comparison with similar homes in the area
Home Values in the Area
Average Home Value in this Area
Purchase History
| Date | Buyer | Sale Price | Title Company |
|---|---|---|---|
| Cromer Barbara B | -- | -- | |
| Cromer Ray E | $382,500 | -- | |
| Rodriquez Nelson J | -- | -- | |
| Rodriquez Nelson J | $44,000 | -- | |
| Richter Gregory | -- | -- | |
| Richter Gregory | -- | -- | |
| Smith David Wayne | $32,000 | -- | |
| Richter Gregory J | $150,000 | -- | |
| Folsom Sidney Rann | -- | -- |
Source: Public Records
Tax History Compared to Growth
Tax History
| Year | Tax Paid | Tax Assessment Tax Assessment Total Assessment is a certain percentage of the fair market value that is determined by local assessors to be the total taxable value of land and additions on the property. | Land | Improvement |
|---|---|---|---|---|
| 2024 | $4,873 | $195,278 | $37,600 | $157,678 |
| 2023 | $3,964 | $156,620 | $37,600 | $119,020 |
| 2022 | $3,904 | $154,456 | $37,600 | $116,856 |
| 2021 | $3,970 | $133,894 | $37,600 | $96,294 |
| 2020 | $3,513 | $133,894 | $37,600 | $96,294 |
| 2019 | $3,489 | $133,894 | $37,600 | $96,294 |
| 2018 | $3,582 | $132,658 | $26,352 | $106,306 |
| 2017 | $4,080 | $132,658 | $26,352 | $106,306 |
| 2016 | $3,121 | $138,000 | $31,694 | $106,306 |
| 2015 | -- | $138,000 | $31,694 | $106,306 |
| 2014 | -- | $138,624 | $36,234 | $102,390 |
| 2013 | -- | $143,145 | $36,234 | $106,911 |
Source: Public Records
Map
Nearby Homes
- Lot 1, 2 Scenic Route
- 580 Scenic Route
- Lot 3,4 Scenic Route
- 115 Ellis Ct
- 515 Scenic Route
- 600 Scenic Route
- 466 Scenic Route
- 850 Scenic Route
- 631 Flintside Dr
- 153 Landing Rd
- 984 Scenic Route
- 141 Landing Rd
- 418 Flintside Dr
- 687 Flintside Dr
- 475 N Cedar Creek Rd
- 103 Cedar Slough Ct
- 251 N Cedar Creek Rd
- 0 Lot #3 & Part Lot#4 Unit 59461
- 111 Cedar Creek Rd S
- 0 Coney Rd S
- 119 Lincolm Pinch Way
- 127 Lincolm Pinch Way
- 127 Lincolm Pinch Way
- Lot 5 Lincolm Pinch Cove
- Lot#1 Lincolm Pinch Way
- Lot # 1 Lincolm Pinch Way
- Lot 13 Lincolm Pinch Way
- xyz Lincolm Pinch Way
- 10 Lincolm Pinch Way
- 0 Lincolm Pinch Way
- Lot 11 Lincolm Pinch Way
- 145 Lincolm Pinch Way
- 131 Lincolm Pinch Way
- 676 Scenic Route
- 664 Scenic Route
- 112 Lincolm Pinch Way
- 688 Scenic Route
- 120 Lincolm Pinch Way
- 138 Lincolm Pinch Way
- 11 Lincolm Pinch Way