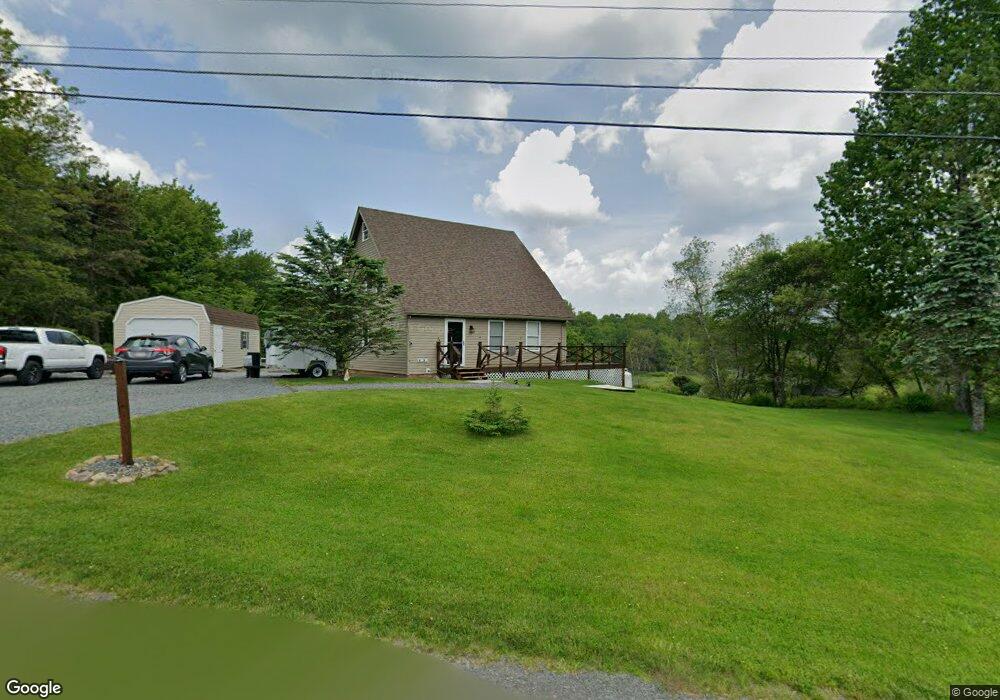
123 Lower Deer Lake Ct Long Pond, PA 18334
Estimated Value: $168,000 - $295,000
3
Beds
3
Baths
1,008
Sq Ft
$245/Sq Ft
Est. Value
About This Home
This home is located at 123 Lower Deer Lake Ct, Long Pond, PA 18334 and is currently estimated at $247,099, approximately $245 per square foot. 123 Lower Deer Lake Ct is a home located in Monroe County with nearby schools including Clear Run Intermediate School, Pocono Mountain West Junior High School, and Pocono Mountain West High School.
Ownership History
Date
Name
Owned For
Owner Type
Purchase Details
Closed on
Oct 18, 2012
Sold by
Fannie Mae
Bought by
Yashin Konstantin and Yashin Olga
Current Estimated Value
Home Financials for this Owner
Home Financials are based on the most recent Mortgage that was taken out on this home.
Original Mortgage
$53,910
Outstanding Balance
$37,436
Interest Rate
3.57%
Mortgage Type
New Conventional
Estimated Equity
$209,663
Purchase Details
Closed on
Nov 9, 2011
Sold by
Sniadowski Leszek and Olewiecka Agnieszka
Bought by
Federal National Mortgage Association
Purchase Details
Closed on
Jun 30, 2005
Sold by
Trj Sales Inc
Bought by
Sniadowski Leszek and Olewiecka Agnieszka
Purchase Details
Closed on
Feb 10, 2005
Sold by
Haverland William A
Bought by
Trj Sales Inc
Create a Home Valuation Report for This Property
The Home Valuation Report is an in-depth analysis detailing your home's value as well as a comparison with similar homes in the area
Home Values in the Area
Average Home Value in this Area
Purchase History
| Date | Buyer | Sale Price | Title Company |
|---|---|---|---|
| Yashin Konstantin | $59,900 | None Available | |
| Federal National Mortgage Association | -- | None Available | |
| Sniadowski Leszek | $133,000 | None Available | |
| Trj Sales Inc | $90,000 | Integrity Abstract |
Source: Public Records
Mortgage History
| Date | Status | Borrower | Loan Amount |
|---|---|---|---|
| Open | Yashin Konstantin | $53,910 |
Source: Public Records
Tax History Compared to Growth
Tax History
| Year | Tax Paid | Tax Assessment Tax Assessment Total Assessment is a certain percentage of the fair market value that is determined by local assessors to be the total taxable value of land and additions on the property. | Land | Improvement |
|---|---|---|---|---|
| 2025 | $712 | $97,100 | $19,520 | $77,580 |
| 2024 | $581 | $97,100 | $19,520 | $77,580 |
| 2023 | $2,469 | $97,100 | $19,520 | $77,580 |
| 2022 | $2,199 | $88,030 | $19,520 | $68,510 |
| 2021 | $2,199 | $88,030 | $19,520 | $68,510 |
| 2020 | $1,760 | $88,030 | $19,520 | $68,510 |
| 2019 | $2,497 | $14,880 | $3,600 | $11,280 |
| 2018 | $2,497 | $14,880 | $3,600 | $11,280 |
| 2017 | $2,526 | $14,880 | $3,600 | $11,280 |
| 2016 | $498 | $14,880 | $3,600 | $11,280 |
| 2015 | -- | $14,880 | $3,600 | $11,280 |
| 2014 | -- | $14,880 | $3,600 | $11,280 |
Source: Public Records
Map
Nearby Homes
- lot 5916 Wild Laurel Dr
- lot 5915 Wild Laurel Dr
- 119 Tumbleweed Dr
- lot 5881 Tumbleweed Dr
- lot 5882 Tumbleweed Dr
- 2133 Wild Laurel Dr
- 1456 Clover Rd
- 1488 Clover Rd
- 1224 Clover Rd
- 1280 Clover Rd
- 265 Cedar Dr
- 200 W Clover Ct
- 7150 Glade Dr
- 306 Cedar Dr
- 161 Beaver Dam Rd
- 130 Granite Rd
- 112 N Glade Ct
- 1591 Clover Rd
- 7139 Country Ct
- 1325 Glade Dr Unit Lot 7143
- 129 Lower Deer Lake Ct
- 5854 Lower Deer Lake Ct
- 5859 Lower Deer Lake Ct
- 5871 Lower Deer Lake Ct
- 5872 Lower Deer Lake Ct
- 5866 Lower Deer Lake Ct
- 130 Lower Deer Lake Ct
- 111 Lower Deer Lake Ct
- 2121 Wild Laurel Dr
- 107 Lower Deer Lake Ct
- 2117 Wild Laurel Dr
- 20 Glade Dr
- 1467 Clover Rd
- 2127 Wild Laurel Dr
- 5872 Deer Lake Ct
- 165 Tumbleweed Dr
- 2129 Wild Laurel Dr
- 148 Lower Deer Lake Ct
- 5847 Wild Laurel Dr
- 2107 Wild Laurel Dr