123 Lyndon Rd Cranston, RI 02905
Edgewood NeighborhoodEstimated Value: $428,000 - $461,000
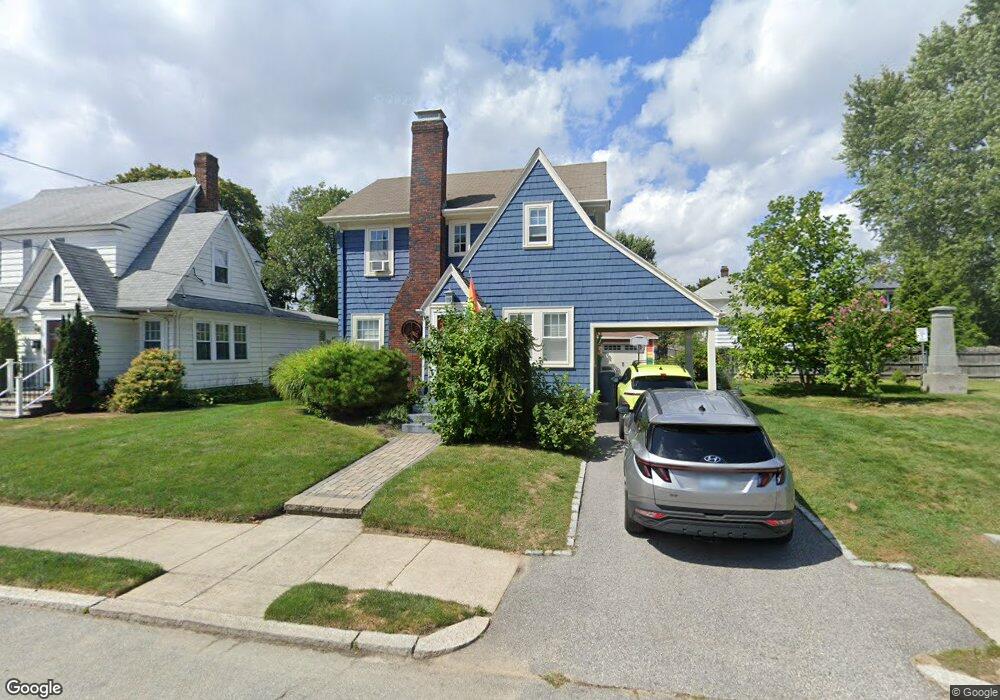
About This Home
This home is located at 123 Lyndon Rd, Cranston, RI 02905 and is currently estimated at $440,578, approximately $327 per square foot. 123 Lyndon Rd is a home located in Providence County with nearby schools including Edgewood Highland Elementary School, Edward S. Rhodes School, and Park View Middle School.
Ownership History
We collect this data history from publicly available records. To have your information removed, we recommend requesting removal directly through your county’s website.
Purchase Details
Home Financials for this Owner
Home Financials are based on the most recent Mortgage that was taken out on this home.Home Values in the Area
Average Home Value in this Area
Purchase History
We collect this data history from publicly available records. To have your information removed, we recommend requesting removal directly through your county’s website.
| Date | Buyer | Sale Price | Title Company |
|---|---|---|---|
| $244,000 | -- |
Mortgage History
We collect this data history from publicly available records. To have your information removed, we recommend requesting removal directly through your county’s website.
| Date | Status | Borrower | Loan Amount |
|---|---|---|---|
| Open | $29,000 | ||
| Open | $195,200 | ||
| Closed | $48,800 |
Tax History
We collect this data history from publicly available records. To have your information removed, we recommend requesting removal directly through your county’s website.
| Year | Tax Paid | Tax Assessment Tax Assessment Total Assessment is a certain percentage of the fair market value that is determined by local assessors to be the total taxable value of land and additions on the property. | Land | Improvement |
|---|---|---|---|---|
| 2025 | $4,639 | $334,200 | $107,500 | $226,700 |
| 2024 | $4,548 | $334,200 | $107,500 | $226,700 |
| 2023 | $4,468 | $236,400 | $70,700 | $165,700 |
| 2022 | $4,376 | $236,400 | $70,700 | $165,700 |
| 2021 | $4,255 | $236,400 | $70,700 | $165,700 |
| 2020 | $4,169 | $200,700 | $67,400 | $133,300 |
| 2019 | $4,169 | $200,700 | $67,400 | $133,300 |
| 2018 | $4,072 | $200,700 | $67,400 | $133,300 |
| 2017 | $4,051 | $176,600 | $60,600 | $116,000 |
| 2016 | $3,965 | $176,600 | $60,600 | $116,000 |
| 2015 | $3,965 | $176,600 | $60,600 | $116,000 |
| 2014 | $3,698 | $161,900 | $60,600 | $101,300 |
Map
- 111 Roger Williams Cir
- 31 Denver Ave
- 83 Holmes Rd
- 27 Cliffdale Ave
- 19 Netherlands Ave
- 79 Arcadia Ave
- 53 Netherlands Ave
- 108 Western Promenade
- 105 Park Ave
- 58 Perkins Ave
- 64 Perkins Ave
- 111 Lakeside Ave
- 70 Perkins Ave
- 234 3rd Ave
- 9 Youlden Ave
- 53 Edgewood Ave
- 129 1st Ave
- 70 Tucker Ave
- 116 2nd Ave
- 41 Berwick Ln
Ask me questions while you tour the home.