123 Megan Ct Unit Lot 33 Eatonton, GA 31024
Estimated Value: $343,000 - $530,000
--
Bed
2
Baths
1,714
Sq Ft
$231/Sq Ft
Est. Value
About This Home
This home is located at 123 Megan Ct Unit Lot 33, Eatonton, GA 31024 and is currently estimated at $395,157, approximately $230 per square foot. 123 Megan Ct Unit Lot 33 is a home located in Putnam County with nearby schools including Putnam County Primary School, Putnam County Elementary School, and Putnam County Middle School.
Ownership History
Date
Name
Owned For
Owner Type
Purchase Details
Closed on
Jul 14, 2023
Sold by
Mills Blake A
Bought by
Mills Property Management Llc
Current Estimated Value
Purchase Details
Closed on
Apr 21, 2022
Sold by
Fisher Michael Joseph
Bought by
Mills Blake A
Home Financials for this Owner
Home Financials are based on the most recent Mortgage that was taken out on this home.
Original Mortgage
$261,000
Interest Rate
3.85%
Mortgage Type
New Conventional
Purchase Details
Closed on
Aug 25, 2020
Sold by
Sdc Gwinnett Llc
Bought by
Fisher Michael Joseph and Fisher Theresa Fillipone
Purchase Details
Closed on
Jul 29, 2019
Sold by
Cantrell James
Bought by
Sdc Gwinnett Llc
Purchase Details
Closed on
Jun 20, 2013
Sold by
State Bank & Trust Co
Bought by
Cantrell James and Crossing Phoenix Land Trust
Create a Home Valuation Report for This Property
The Home Valuation Report is an in-depth analysis detailing your home's value as well as a comparison with similar homes in the area
Home Values in the Area
Average Home Value in this Area
Purchase History
| Date | Buyer | Sale Price | Title Company |
|---|---|---|---|
| Mills Property Management Llc | -- | -- | |
| Mills Blake A | $290,000 | -- | |
| Fisher Michael Joseph | $241,005 | -- | |
| Sdc Gwinnett Llc | $247,500 | -- | |
| Cantrell James | $155,100 | -- |
Source: Public Records
Mortgage History
| Date | Status | Borrower | Loan Amount |
|---|---|---|---|
| Previous Owner | Mills Blake A | $261,000 |
Source: Public Records
Tax History Compared to Growth
Tax History
| Year | Tax Paid | Tax Assessment Tax Assessment Total Assessment is a certain percentage of the fair market value that is determined by local assessors to be the total taxable value of land and additions on the property. | Land | Improvement |
|---|---|---|---|---|
| 2024 | $2,228 | $129,338 | $12,000 | $117,338 |
| 2023 | $2,228 | $129,559 | $12,000 | $117,559 |
| 2022 | $1,792 | $115,729 | $12,000 | $103,729 |
| 2021 | $1,969 | $96,426 | $11,000 | $85,426 |
| 2020 | $267 | $11,000 | $11,000 | $0 |
| 2019 | $133 | $5,398 | $5,398 | $0 |
| 2018 | $148 | $5,938 | $5,938 | $0 |
| 2017 | $122 | $5,398 | $5,398 | $0 |
| 2016 | $122 | $5,398 | $5,398 | $0 |
| 2015 | $117 | $5,398 | $5,399 | $0 |
| 2014 | $118 | $5,399 | $5,399 | $0 |
Source: Public Records
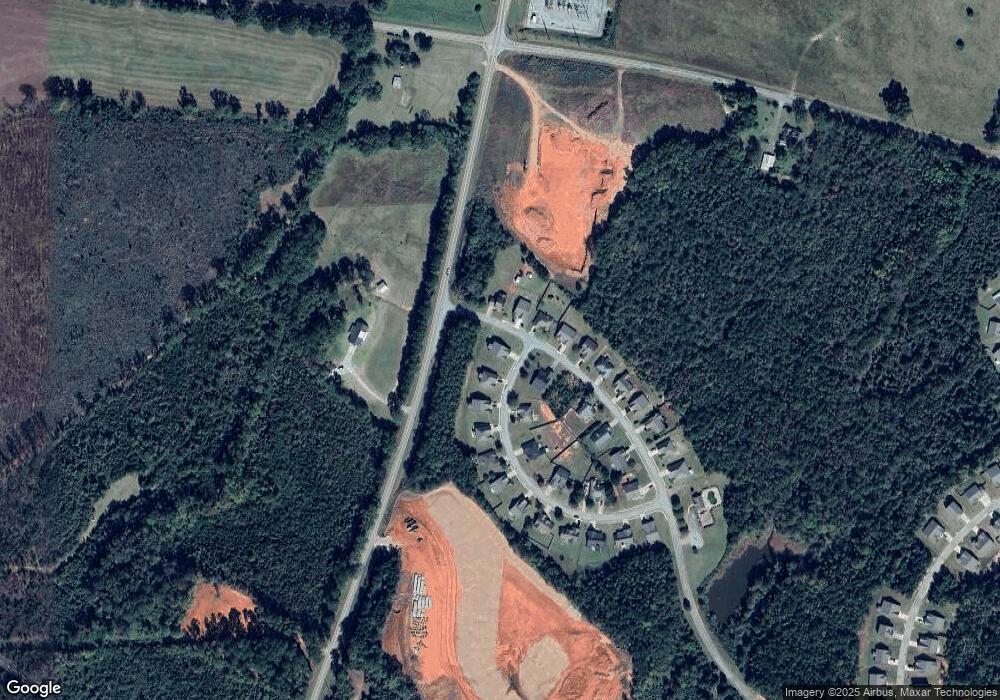
Map
Nearby Homes
- 179 Garrett Dr
- The Foxcroft Plan at Maddox Station
- The Lancaster Plan at Maddox Station
- The Bradley Plan at Maddox Station
- The Crawford Plan at Maddox Station
- The Coleman Plan at Maddox Station
- The Harrington Plan at Maddox Station
- The McGinnis Plan at Maddox Station
- The Pearson Plan at Maddox Station
- 135 Creekside Rd
- 135 Creekside Rd Unit (LOT 21)
- 129 Creekside Rd
- 131 Creekside Rd
- 131 Creekside Rd Unit (LOT 20)
- 126 Creekside Rd Unit (LOT 46)
- 122 Creekside Rd Unit (LOT 48)
- 129 Creekside Rd Unit (LOT 19)
- 110 Colin Ln
- 150 Creekside Rd Unit LOT 34
- 118 Garrett Dr
- 123 Megan Ct
- 0 Garrett Dr Unit LOT 2 3110019
- 0 Garrett Dr Unit LOT 4 3244570
- 0 Garrett Dr Unit LOT 16 3244560
- 0 Garrett Dr Unit LT 4 7147600
- 0 Garrett Dr Unit 3160714
- 0 Garrett Dr Unit 8954004
- 0 Garrett Dr Unit 8953680
- 0 Garrett Dr Unit 8954017
- 0 Garrett Dr Unit 8758677
- 0 Garrett Dr Unit 9033620
- 0 Garrett Dr Unit 8974392
- 0 Garrett Dr Unit 8863705
- 0 Garrett Dr Unit 8878041
- 0 Garrett Dr Unit 3153096
- 0 Garrett Dr Unit 7249283
- 0 Garrett Dr Unit 8155095
- 0 Garrett Dr Unit 8314899
- 0 Garrett Dr Unit 8679612
- 121 Megan Ct Unit Lot 32