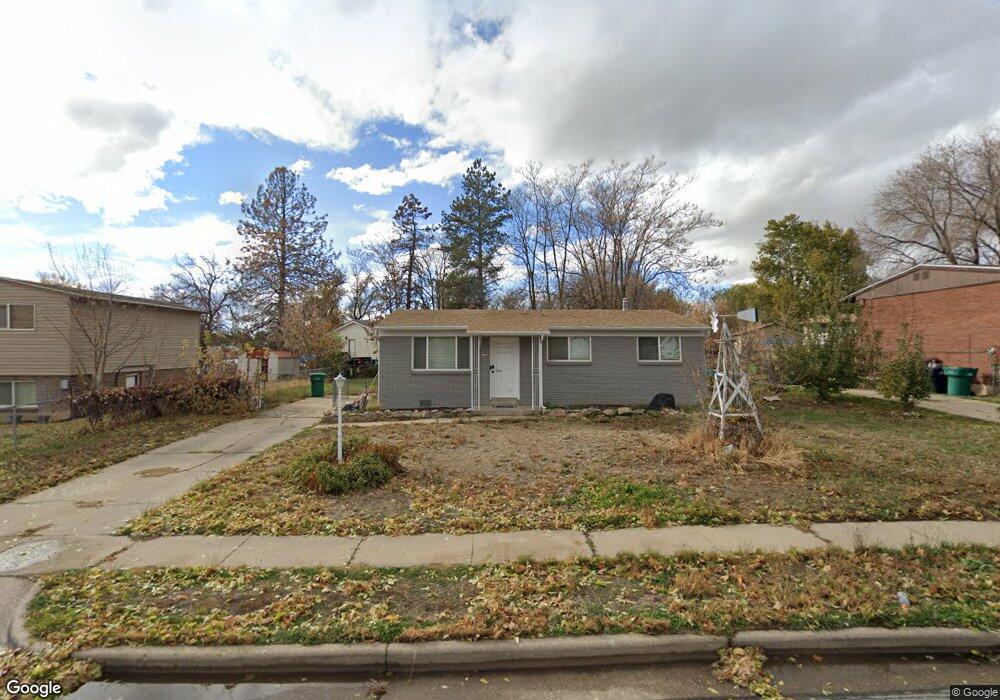
123 N 575 W Layton, UT 84041
Estimated Value: $357,000 - $372,915
3
Beds
1
Bath
900
Sq Ft
$406/Sq Ft
Est. Value
About This Home
This home is located at 123 N 575 W, Layton, UT 84041 and is currently estimated at $365,229, approximately $405 per square foot. 123 N 575 W is a home located in Davis County with nearby schools including Layton Elementary School, Fairfield Junior High School, and Layton High School.
Ownership History
Date
Name
Owned For
Owner Type
Purchase Details
Closed on
Feb 28, 2020
Sold by
Castillo Darleen C and Spackman Clifton K
Bought by
Castillo Austin Jeffrey
Current Estimated Value
Home Financials for this Owner
Home Financials are based on the most recent Mortgage that was taken out on this home.
Original Mortgage
$119,000
Outstanding Balance
$93,864
Interest Rate
3.6%
Mortgage Type
New Conventional
Estimated Equity
$271,365
Purchase Details
Closed on
May 4, 2018
Sold by
Spackman Clifton K
Bought by
Spackman Clifton K and Spackman Revocable Trust
Purchase Details
Closed on
Feb 25, 2000
Sold by
Spackman Steven Reed
Bought by
Spackman Clifton K
Home Financials for this Owner
Home Financials are based on the most recent Mortgage that was taken out on this home.
Original Mortgage
$75,512
Interest Rate
8.16%
Mortgage Type
FHA
Create a Home Valuation Report for This Property
The Home Valuation Report is an in-depth analysis detailing your home's value as well as a comparison with similar homes in the area
Home Values in the Area
Average Home Value in this Area
Purchase History
| Date | Buyer | Sale Price | Title Company |
|---|---|---|---|
| Castillo Austin Jeffrey | -- | Hickman Land Title Co | |
| Spackman Clifton K | -- | None Available | |
| Spackman Clifton K | -- | First American Title Co |
Source: Public Records
Mortgage History
| Date | Status | Borrower | Loan Amount |
|---|---|---|---|
| Open | Castillo Austin Jeffrey | $119,000 | |
| Previous Owner | Spackman Clifton K | $75,512 |
Source: Public Records
Tax History
| Year | Tax Paid | Tax Assessment Tax Assessment Total Assessment is a certain percentage of the fair market value that is determined by local assessors to be the total taxable value of land and additions on the property. | Land | Improvement |
|---|---|---|---|---|
| 2025 | $1,635 | $171,600 | $107,584 | $64,016 |
| 2024 | $1,581 | $167,199 | $119,689 | $47,510 |
| 2023 | $1,465 | $150,150 | $64,390 | $85,759 |
| 2022 | $1,549 | $285,000 | $134,788 | $150,212 |
| 2021 | $1,451 | $219,000 | $111,232 | $107,768 |
| 2020 | $1,305 | $189,000 | $93,301 | $95,699 |
| 2019 | $1,269 | $180,000 | $96,582 | $83,418 |
| 2018 | $1,138 | $162,000 | $84,614 | $77,386 |
| 2016 | $845 | $62,040 | $32,811 | $29,229 |
| 2015 | $804 | $56,100 | $32,811 | $23,289 |
| 2014 | $730 | $52,052 | $32,811 | $19,241 |
| 2013 | -- | $54,139 | $17,588 | $36,551 |
Source: Public Records
Map
Nearby Homes
- 630 W 100 N
- 270 N 630 W
- 418 W Gentile St
- 750 W Gentile St
- 771 W Gentile St
- 355 W Gentile St
- 339 W 25 N Unit 6
- 24 Grover St
- 6 Grover St
- 526 King St Unit 2
- 174 W Dawson St
- 383 S 950 W
- 34 E 525 N
- 189 S Main St Unit 76
- 189 S Main St Unit 21
- 1113 W Angel Hill Ct
- 278 W Francis Ave
- 1677 N 1600 W Unit 134
- 753 S 300 E
- 557 S Angel St