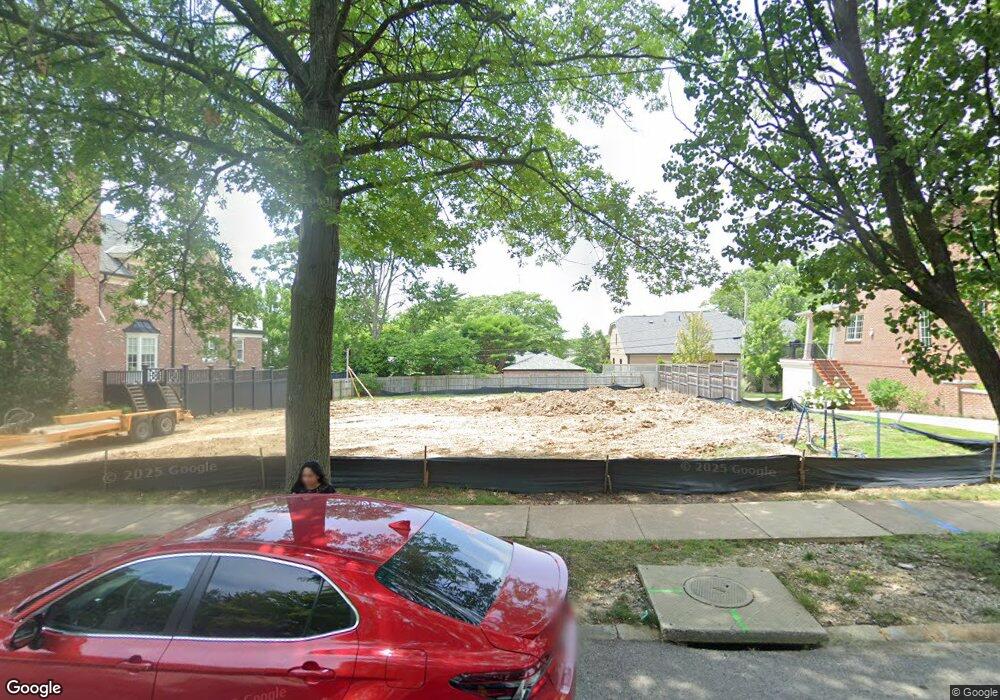
123 N Forsyth Blvd Saint Louis, MO 63105
Downtown Clayton NeighborhoodEstimated Value: $949,860 - $1,362,000
3
Beds
3
Baths
1,969
Sq Ft
$585/Sq Ft
Est. Value
About This Home
This home is located at 123 N Forsyth Blvd, Saint Louis, MO 63105 and is currently estimated at $1,151,715, approximately $584 per square foot. 123 N Forsyth Blvd is a home located in St. Louis County with nearby schools including Meramec Elementary, Wydown Middle School, and Clayton High School.
Ownership History
Date
Name
Owned For
Owner Type
Purchase Details
Closed on
Sep 30, 2021
Sold by
Sharma Anshuman and Pasrlja Meena
Bought by
123 N Forsyth Llc
Current Estimated Value
Purchase Details
Closed on
Sep 29, 2021
Sold by
Sharma Anshuman and Pasrija Meena
Bought by
123 N Forsyth Llc
Purchase Details
Closed on
Sep 1, 2009
Sold by
Sharma Anshuman and Pasrija Meena
Bought by
Sharma Anshuman and Pasrija Meena
Home Financials for this Owner
Home Financials are based on the most recent Mortgage that was taken out on this home.
Original Mortgage
$271,500
Interest Rate
4.66%
Mortgage Type
New Conventional
Purchase Details
Closed on
Oct 24, 2001
Sold by
Mason John E and Mason Mary Vest
Bought by
Anshuman Sharma and Pasrija Meena
Home Financials for this Owner
Home Financials are based on the most recent Mortgage that was taken out on this home.
Original Mortgage
$354,050
Interest Rate
6.37%
Mortgage Type
Purchase Money Mortgage
Create a Home Valuation Report for This Property
The Home Valuation Report is an in-depth analysis detailing your home's value as well as a comparison with similar homes in the area
Home Values in the Area
Average Home Value in this Area
Purchase History
| Date | Buyer | Sale Price | Title Company |
|---|---|---|---|
| 123 N Forsyth Llc | -- | Us Title | |
| 123 N Forsyth Llc | $906,000 | Us Title Kirkwood | |
| Sharma Anshuman | -- | None Available | |
| Anshuman Sharma | $365,000 | -- |
Source: Public Records
Mortgage History
| Date | Status | Borrower | Loan Amount |
|---|---|---|---|
| Previous Owner | Sharma Anshuman | $271,500 | |
| Previous Owner | Anshuman Sharma | $354,050 |
Source: Public Records
Tax History Compared to Growth
Tax History
| Year | Tax Paid | Tax Assessment Tax Assessment Total Assessment is a certain percentage of the fair market value that is determined by local assessors to be the total taxable value of land and additions on the property. | Land | Improvement |
|---|---|---|---|---|
| 2025 | $10,826 | $179,260 | $166,970 | $12,290 |
| 2024 | $10,826 | $159,110 | $140,600 | $18,510 |
| 2023 | $10,826 | $159,110 | $140,600 | $18,510 |
| 2022 | $11,864 | $165,170 | $131,820 | $33,350 |
| 2021 | $11,822 | $165,170 | $131,820 | $33,350 |
| 2020 | $10,273 | $138,990 | $133,760 | $5,230 |
| 2019 | $10,136 | $138,990 | $133,760 | $5,230 |
| 2018 | $8,445 | $117,780 | $105,450 | $12,330 |
| 2017 | $8,389 | $117,780 | $105,450 | $12,330 |
| 2016 | $6,345 | $84,760 | $70,300 | $14,460 |
| 2015 | $6,401 | $84,760 | $70,300 | $14,460 |
| 2014 | $6,552 | $83,340 | $26,660 | $56,680 |
Source: Public Records
Map
Nearby Homes
- 8145 University Dr
- 8250 Forsyth Blvd Unit 109
- 8250 Forsyth Blvd Unit 303
- 8250 Forsyth Blvd Unit 402
- 8250 Forsyth Blvd Unit 408
- 8250 Forsyth Blvd Unit 405
- 8250 Forsyth Blvd Unit 210
- 8250 Forsyth Blvd Unit 103
- 8250 Forsyth Blvd Unit 209
- 8250 Forsyth Blvd Unit 404
- 8250 Forsyth Blvd Unit 105
- 8250 Forsyth Blvd Unit 208
- 8250 Forsyth Blvd Unit 401
- 8250 Forsyth Blvd Unit 310
- 8250 Forsyth Blvd Unit 107
- 8250 Forsyth Blvd Unit 406
- 8250 Forsyth Blvd Unit 403
- 8250 Forsyth Blvd Unit 104
- 8250 Forsyth Blvd Unit 407
- 8250 Forsyth Blvd Unit 302
- 129 N Forsyth Blvd
- 111 N Forsyth Blvd
- 114 Brighton Way
- 126 Brighton Way
- 110 Brighton Way
- 135 N Forsyth Blvd
- 130 Brighton Way
- 140 N Forsyth Blvd
- 120 N Forsyth Blvd
- 8146 Westmoreland Ave
- 141 N Forsyth Blvd
- 180 N Forsyth Blvd
- 140 Brighton Way
- 8141 Westmoreland Ave
- 8144 Westmoreland Ave
- 115 Brighton Way
- 121 Brighton Way
- 111 Brighton Way
- 125 Brighton Way
- 8140 University Dr