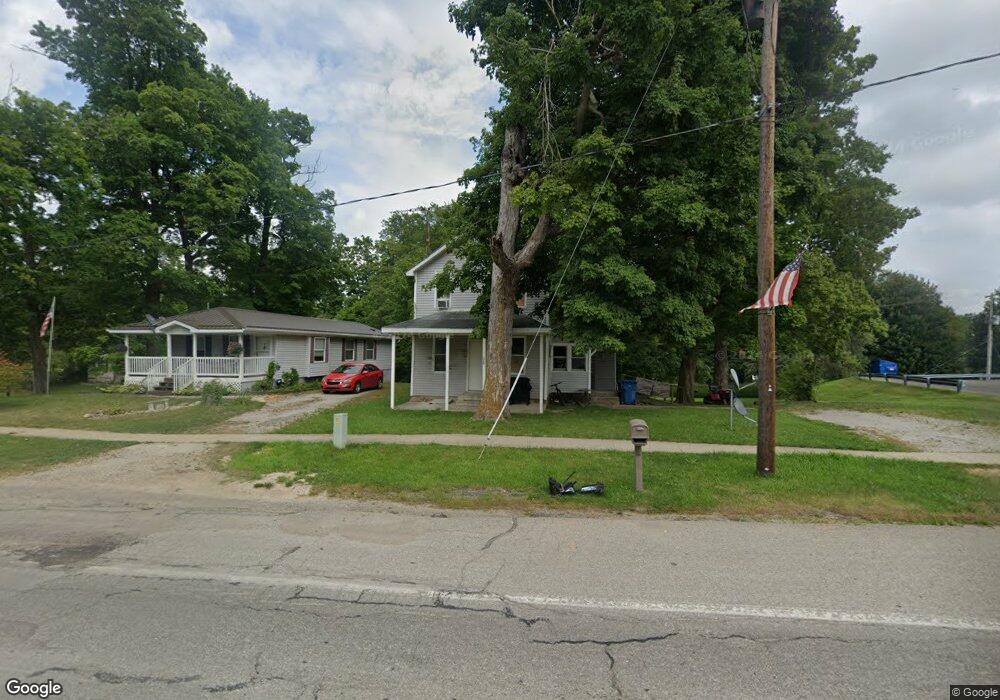
123 N Main St Camden, MI 49232
Estimated Value: $101,164 - $200,000
4
Beds
1
Bath
1,400
Sq Ft
$101/Sq Ft
Est. Value
About This Home
This home is located at 123 N Main St, Camden, MI 49232 and is currently estimated at $141,541, approximately $101 per square foot. 123 N Main St is a home located in Hillsdale County with nearby schools including Camden-Frontier K-8 School, Camden-Frontier High School, and Ridgeview Camden School.
Ownership History
Date
Name
Owned For
Owner Type
Purchase Details
Closed on
Dec 6, 2017
Sold by
Holdshire Amy C
Bought by
Holdshire Mark R
Current Estimated Value
Purchase Details
Closed on
Apr 29, 2010
Sold by
Monarch Community Bank
Bought by
Hodshire Mark and Hodshire Amy
Purchase Details
Closed on
Sep 25, 2007
Sold by
Snyder Gary H and Snyder Penny S
Bought by
Drummond James E and Drummond Michelle
Home Financials for this Owner
Home Financials are based on the most recent Mortgage that was taken out on this home.
Original Mortgage
$55,000
Interest Rate
6.55%
Mortgage Type
Unknown
Purchase Details
Closed on
Mar 21, 1994
Sold by
Avra Alan Keith and Avra Patti A
Bought by
Kurtz Virginia N and Kurtz Laverne G
Purchase Details
Closed on
Aug 13, 1990
Sold by
Spieth Forrest and Spieth Elsie
Bought by
Avra Alan Keith
Purchase Details
Closed on
Jun 15, 1977
Bought by
Bump
Create a Home Valuation Report for This Property
The Home Valuation Report is an in-depth analysis detailing your home's value as well as a comparison with similar homes in the area
Home Values in the Area
Average Home Value in this Area
Purchase History
| Date | Buyer | Sale Price | Title Company |
|---|---|---|---|
| Holdshire Mark R | -- | None Available | |
| Hodshire Mark | $11,330 | Midstate Title | |
| Drummond James E | $55,000 | First American Title | |
| Kurtz Virginia N | $15,500 | -- | |
| Avra Alan Keith | $6,100 | -- | |
| Bump | $15,500 | -- |
Source: Public Records
Mortgage History
| Date | Status | Borrower | Loan Amount |
|---|---|---|---|
| Previous Owner | Drummond James E | $55,000 |
Source: Public Records
Tax History Compared to Growth
Tax History
| Year | Tax Paid | Tax Assessment Tax Assessment Total Assessment is a certain percentage of the fair market value that is determined by local assessors to be the total taxable value of land and additions on the property. | Land | Improvement |
|---|---|---|---|---|
| 2025 | $835 | $34,300 | $0 | $0 |
| 2024 | $318 | $39,700 | $0 | $0 |
| 2023 | $305 | $36,200 | $0 | $0 |
| 2022 | $737 | $26,200 | $0 | $0 |
| 2021 | $737 | $23,900 | $0 | $0 |
| 2020 | $743 | $22,800 | $0 | $0 |
| 2019 | $724 | $21,500 | $0 | $0 |
| 2018 | $705 | $13,700 | $0 | $0 |
| 2017 | $687 | $14,560 | $0 | $0 |
| 2016 | $680 | $13,490 | $0 | $0 |
| 2015 | $148 | $13,490 | $0 | $0 |
| 2013 | $193 | $17,720 | $0 | $0 |
| 2012 | $189 | $17,230 | $0 | $0 |
Source: Public Records
Map
Nearby Homes
- 107 Mary St
- 6524 W Montgomery Rd
- 9677 W Camden Rd
- 115 N Michigan St
- 219 N Hayward St
- 0 W Territorial Rd Unit 25043960
- 0 W Territorial Rd Unit 11603977
- 0 Dimmers Rd
- 9949 Indian Trail
- 7944 Gilmore Rd
- 7841 Topinabee Dr
- 18405 County Road 2-50
- 5411 Lilac Rd
- 0 W Silver St Unit 25044322
- 309 S Main St
- 7950 E 400 N
- 5050 N 725 E
- 108 Lynn St
- 203 E Michigan St
- V/L Delmar Rd