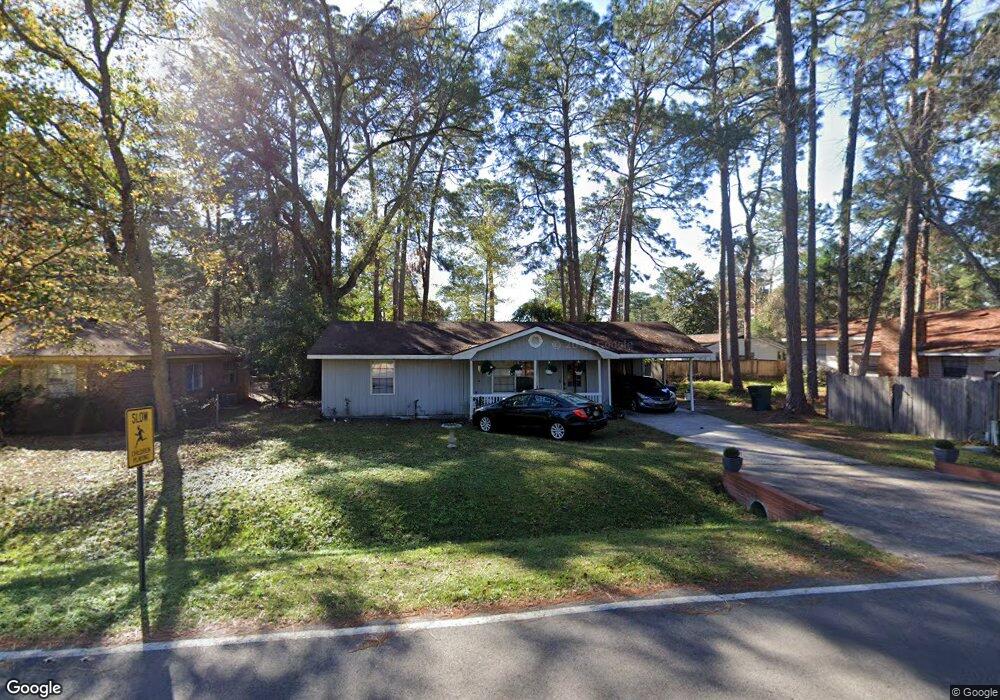
123 Pointe Dr S Hinesville, GA 31313
Estimated Value: $135,000 - $191,000
3
Beds
1
Bath
984
Sq Ft
$170/Sq Ft
Est. Value
About This Home
This home is located at 123 Pointe Dr S, Hinesville, GA 31313 and is currently estimated at $167,507, approximately $170 per square foot. 123 Pointe Dr S is a home located in Liberty County with nearby schools including Frank Long Elementary School, Snelson-Golden Middle School, and Bradwell Institute.
Ownership History
Date
Name
Owned For
Owner Type
Purchase Details
Closed on
Aug 30, 2017
Sold by
Powers Rodney
Bought by
Jo-An Robinson and Robinson Roberto A
Current Estimated Value
Home Financials for this Owner
Home Financials are based on the most recent Mortgage that was taken out on this home.
Original Mortgage
$62,840
Outstanding Balance
$52,263
Interest Rate
3.75%
Mortgage Type
FHA
Estimated Equity
$115,244
Purchase Details
Closed on
Aug 22, 2005
Sold by
Heritage Bank
Bought by
Dixon Inc
Home Financials for this Owner
Home Financials are based on the most recent Mortgage that was taken out on this home.
Original Mortgage
$46,700
Interest Rate
5.64%
Mortgage Type
New Conventional
Purchase Details
Closed on
Mar 26, 2002
Sold by
Dixon Don A
Bought by
Dixon Inc
Purchase Details
Closed on
Nov 28, 2001
Sold by
Booton Paul
Bought by
Dixon Don A
Purchase Details
Closed on
May 22, 1981
Bought by
Booton Paul
Create a Home Valuation Report for This Property
The Home Valuation Report is an in-depth analysis detailing your home's value as well as a comparison with similar homes in the area
Home Values in the Area
Average Home Value in this Area
Purchase History
| Date | Buyer | Sale Price | Title Company |
|---|---|---|---|
| Jo-An Robinson | $64,000 | -- | |
| Dixon Inc | -- | -- | |
| Powers Rodney K | $51,900 | -- | |
| Dixon Inc | -- | -- | |
| Dixon Don A | $30,000 | -- | |
| Booton Paul | $8,000 | -- |
Source: Public Records
Mortgage History
| Date | Status | Borrower | Loan Amount |
|---|---|---|---|
| Open | Jo-An Robinson | $62,840 | |
| Previous Owner | Powers Rodney K | $46,700 |
Source: Public Records
Tax History Compared to Growth
Tax History
| Year | Tax Paid | Tax Assessment Tax Assessment Total Assessment is a certain percentage of the fair market value that is determined by local assessors to be the total taxable value of land and additions on the property. | Land | Improvement |
|---|---|---|---|---|
| 2024 | $2,386 | $48,416 | $12,000 | $36,416 |
| 2023 | $2,386 | $40,601 | $12,000 | $28,601 |
| 2022 | $1,229 | $26,122 | $6,000 | $20,122 |
| 2021 | $1,156 | $24,110 | $6,000 | $18,110 |
| 2020 | $1,136 | $23,461 | $6,000 | $17,461 |
| 2019 | $1,139 | $23,718 | $6,000 | $17,718 |
| 2018 | $1,145 | $23,975 | $6,000 | $17,975 |
| 2017 | $798 | $24,232 | $6,000 | $18,232 |
| 2016 | $1,158 | $25,462 | $6,000 | $19,462 |
| 2015 | $1,219 | $25,462 | $6,000 | $19,462 |
| 2014 | $1,219 | $26,530 | $6,000 | $20,530 |
| 2013 | -- | $29,145 | $6,000 | $23,145 |
Source: Public Records
Map
Nearby Homes
- 130 Pointe Dr S
- 910 Brett Dr Unit 53
- 910 Brett Dr
- 1021 Bacon Rd
- 940 Fox Haven Ct
- 0 U S 84
- 14.27+/- Oglethorpe Hwy
- 832 W Oglethorpe Hwy
- 904 W Oglethorpe Hwy
- 14.27 +/- W Oglethorpe Hwy
- 0 W Oglethorpe Hwy
- 818 W Oglethorpe Hwy
- 1032 Varnedoe St
- 1040 Varnedoe St
- 796 Peggy Sue St
- 408 Flowers Dr
- 642 Honey Ridge Ln
- 411 Christopher Dr
- 661 Mahoney Rd
- 700 Kadi Ln
- 123 Pointe South Dr
- 121 Pointe South Dr
- 900 Greenbriar Rd
- 906 Greenbriar Ct
- 902 Greenbriar Rd
- 117 Pointe Dr S
- 117 Pointe South Dr
- 904 Greenbriar Ct
- 122 Pointe South Dr
- 122 Pointe South Dr
- 124 Pointe Dr S
- 908 Greenbriar Ct
- 109 Pointe South Dr
- 124 Pointe South Dr
- 109 Pointe South Dr
- 120 Pointe South Dr
- 126 Pointe Dr S
- 126 Pointe South Dr
- 107 Pointe South Dr
- 107 Pointe Dr S