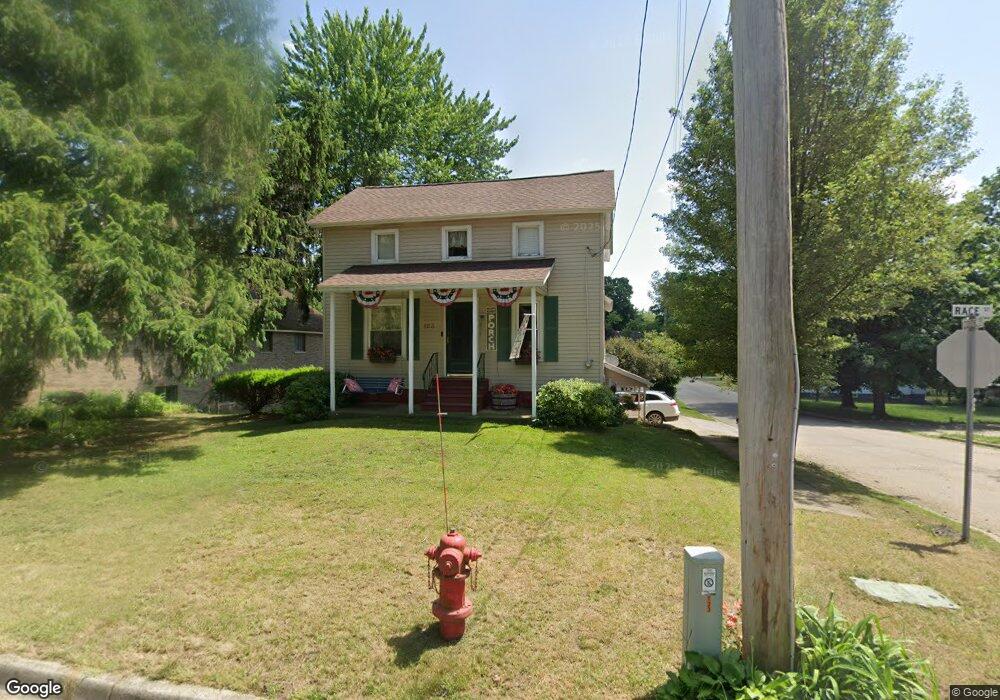
123 Race St Allegan, MI 49010
Estimated Value: $171,000 - $315,000
3
Beds
2
Baths
1,240
Sq Ft
$174/Sq Ft
Est. Value
About This Home
This home is located at 123 Race St, Allegan, MI 49010 and is currently estimated at $215,896, approximately $174 per square foot. 123 Race St is a home located in Allegan County with nearby schools including North Ward Elementary School, L.E. White Middle School, and Allegan High School.
Ownership History
Date
Name
Owned For
Owner Type
Purchase Details
Closed on
Jan 10, 2024
Sold by
Philippus Kimberly Sue
Bought by
Philippus Kimberly Sue
Current Estimated Value
Purchase Details
Closed on
May 16, 2022
Sold by
Julian Philippus Paul and Julian Sue Kimberly
Bought by
Philippus Kimberly Sue
Home Financials for this Owner
Home Financials are based on the most recent Mortgage that was taken out on this home.
Original Mortgage
$74,305
Interest Rate
4.48%
Mortgage Type
New Conventional
Purchase Details
Closed on
Jul 10, 2000
Sold by
Philippus Kim S
Bought by
Philippus Paul and Philippus Kimberly
Purchase Details
Closed on
Apr 1, 1992
Create a Home Valuation Report for This Property
The Home Valuation Report is an in-depth analysis detailing your home's value as well as a comparison with similar homes in the area
Home Values in the Area
Average Home Value in this Area
Purchase History
| Date | Buyer | Sale Price | Title Company |
|---|---|---|---|
| Philippus Kimberly Sue | -- | None Listed On Document | |
| Philippus Kimberly Sue | -- | Dec Frank P | |
| Philippus Paul | -- | -- | |
| -- | $43,900 | -- |
Source: Public Records
Mortgage History
| Date | Status | Borrower | Loan Amount |
|---|---|---|---|
| Previous Owner | Philippus Kimberly Sue | $74,305 |
Source: Public Records
Tax History Compared to Growth
Tax History
| Year | Tax Paid | Tax Assessment Tax Assessment Total Assessment is a certain percentage of the fair market value that is determined by local assessors to be the total taxable value of land and additions on the property. | Land | Improvement |
|---|---|---|---|---|
| 2025 | $1,195 | $66,400 | $16,500 | $49,900 |
| 2024 | $1,088 | $64,200 | $15,800 | $48,400 |
| 2023 | $1,127 | $53,200 | $14,900 | $38,300 |
| 2022 | $1,088 | $44,500 | $12,500 | $32,000 |
| 2021 | $1,040 | $40,700 | $9,900 | $30,800 |
| 2020 | $1,025 | $35,500 | $8,300 | $27,200 |
| 2019 | $1,000 | $31,000 | $7,300 | $23,700 |
| 2018 | $961 | $28,700 | $7,100 | $21,600 |
| 2017 | $0 | $26,300 | $5,900 | $20,400 |
| 2016 | $0 | $21,400 | $5,000 | $16,400 |
| 2015 | -- | $21,400 | $5,000 | $16,400 |
| 2014 | -- | $22,500 | $5,000 | $17,500 |
| 2013 | $1,468 | $23,500 | $5,000 | $18,500 |
Source: Public Records
Map
Nearby Homes