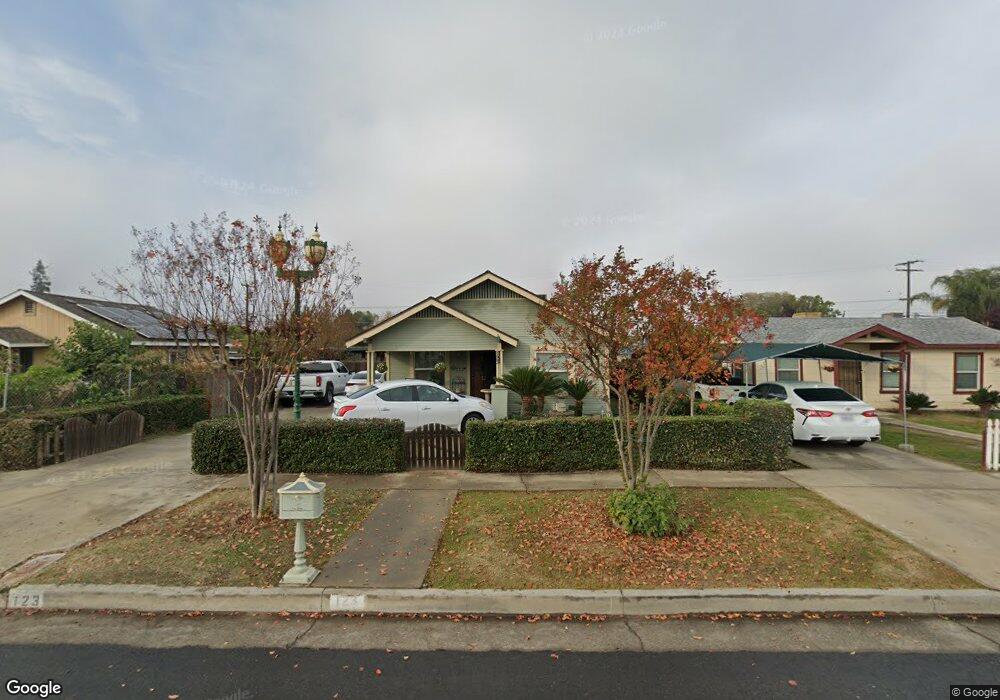
123 S B St Tulare, CA 93274
Estimated Value: $169,000 - $274,000
2
Beds
2
Baths
1,320
Sq Ft
$168/Sq Ft
Est. Value
About This Home
This home is located at 123 S B St, Tulare, CA 93274 and is currently estimated at $221,589, approximately $167 per square foot. 123 S B St is a home located in Tulare County with nearby schools including Maple Elementary School, Mulcahy Middle School, and Tulare Western High School.
Ownership History
Date
Name
Owned For
Owner Type
Purchase Details
Closed on
Jul 24, 2023
Sold by
Baca Jose and Baca Christina
Bought by
Baca Jose and Baca Christina Saldana
Current Estimated Value
Purchase Details
Closed on
Jul 11, 1995
Sold by
Grissom Minnie L
Bought by
Grissom Ray F
Home Financials for this Owner
Home Financials are based on the most recent Mortgage that was taken out on this home.
Original Mortgage
$64,950
Interest Rate
7.61%
Mortgage Type
Purchase Money Mortgage
Purchase Details
Closed on
Jun 26, 1995
Sold by
Grissom Ray F
Bought by
Baca Jose and Contreras Christina
Home Financials for this Owner
Home Financials are based on the most recent Mortgage that was taken out on this home.
Original Mortgage
$64,950
Interest Rate
7.61%
Mortgage Type
Purchase Money Mortgage
Create a Home Valuation Report for This Property
The Home Valuation Report is an in-depth analysis detailing your home's value as well as a comparison with similar homes in the area
Home Values in the Area
Average Home Value in this Area
Purchase History
We collect this data history from publicly available records. To have your information removed, we recommend requesting removal directly through your county’s website.
| Date | Buyer | Sale Price | Title Company |
|---|---|---|---|
| Baca Jose | -- | None Listed On Document | |
| Grissom Ray F | -- | First American Title Ins Co | |
| Baca Jose | $67,000 | First American Title Ins Co |
Source: Public Records
Mortgage History
We collect this data history from publicly available records. To have your information removed, we recommend requesting removal directly through your county’s website.
| Date | Status | Borrower | Loan Amount |
|---|---|---|---|
| Previous Owner | Baca Jose | $64,950 |
Source: Public Records
Tax History
| Year | Tax Paid | Tax Assessment Tax Assessment Total Assessment is a certain percentage of the fair market value that is determined by local assessors to be the total taxable value of land and additions on the property. | Land | Improvement |
|---|---|---|---|---|
| 2025 | $1,147 | $112,538 | $30,229 | $82,309 |
| 2024 | $1,147 | $110,333 | $29,637 | $80,696 |
| 2023 | $1,117 | $108,170 | $29,056 | $79,114 |
| 2022 | $1,082 | $106,050 | $28,487 | $77,563 |
| 2021 | $1,067 | $103,970 | $27,928 | $76,042 |
| 2020 | $1,084 | $102,904 | $27,642 | $75,262 |
| 2019 | $1,110 | $100,886 | $27,100 | $73,786 |
| 2018 | $1,090 | $98,908 | $26,569 | $72,339 |
| 2017 | $1,078 | $96,969 | $26,048 | $70,921 |
| 2016 | $1,030 | $95,067 | $25,537 | $69,530 |
| 2015 | $761 | $92,000 | $23,000 | $69,000 |
| 2014 | $761 | $72,000 | $18,000 | $54,000 |
Source: Public Records
Map
Nearby Homes
- 733 - 735 W Tulare Ave
- 735 W Tulare Ave
- 311 S Pratt St
- 260 N Los Angeles St
- 348 N F St
- 605 N F St
- 560 N F St
- 708 S Van Ness St
- 615 Catalina Cir
- 554 S G St
- 756 S Oliver St
- 748 S Walter St
- 998 W Bardsley Ave
- 0 W Inyo Ave Unit TR26071304
- 1615 W Cross Ave
- 1514 Glory Ave
- 1982 Oak Falls Ct Unit 1 Wo
- 896 Anthem Ct
- 920 Maricopa St
- 1974 Oak Falls Ct Unit 2 Wo
Your Personal Tour Guide
Ask me questions while you tour the home.