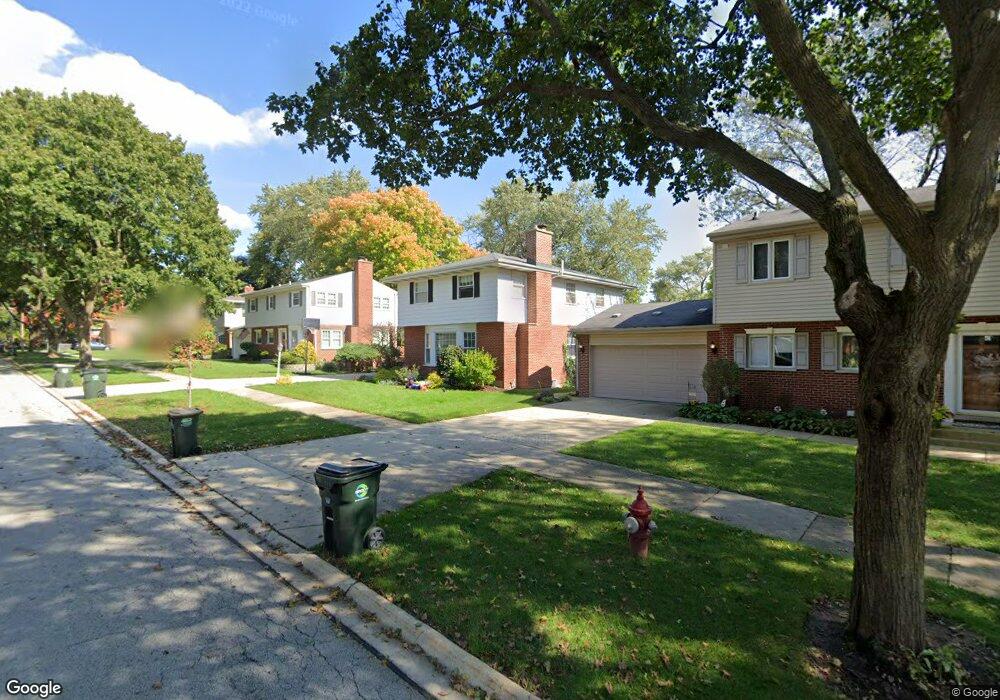
123 S Harvard Ave Arlington Heights, IL 60005
Westgate NeighborhoodEstimated Value: $553,885 - $652,000
4
Beds
3
Baths
1,773
Sq Ft
$335/Sq Ft
Est. Value
About This Home
This home is located at 123 S Harvard Ave, Arlington Heights, IL 60005 and is currently estimated at $594,221, approximately $335 per square foot. 123 S Harvard Ave is a home located in Cook County with nearby schools including Westgate Elementary School, South Middle School, and Rolling Meadows High School.
Ownership History
Date
Name
Owned For
Owner Type
Purchase Details
Closed on
Apr 9, 2010
Sold by
Kay Susan M
Bought by
Murray Michael P and Murray Kathryn L
Current Estimated Value
Home Financials for this Owner
Home Financials are based on the most recent Mortgage that was taken out on this home.
Original Mortgage
$328,000
Outstanding Balance
$218,567
Interest Rate
5.01%
Mortgage Type
New Conventional
Estimated Equity
$375,654
Purchase Details
Closed on
Jan 21, 2008
Sold by
Kay Susan M
Bought by
Kay Susan M and Susan M Kay Revocable Trust
Purchase Details
Closed on
Jun 26, 1995
Sold by
Gettman Kenneth E and Gettman Mary Jane
Bought by
Kay Peter L and Kay Susan M
Home Financials for this Owner
Home Financials are based on the most recent Mortgage that was taken out on this home.
Original Mortgage
$100,000
Interest Rate
7.88%
Create a Home Valuation Report for This Property
The Home Valuation Report is an in-depth analysis detailing your home's value as well as a comparison with similar homes in the area
Home Values in the Area
Average Home Value in this Area
Purchase History
| Date | Buyer | Sale Price | Title Company |
|---|---|---|---|
| Murray Michael P | $410,000 | Fatic | |
| Kay Susan M | -- | None Available | |
| Kay Susan M | -- | None Available | |
| Kay Peter L | $270,000 | -- |
Source: Public Records
Mortgage History
| Date | Status | Borrower | Loan Amount |
|---|---|---|---|
| Open | Murray Michael P | $328,000 | |
| Previous Owner | Kay Peter L | $100,000 |
Source: Public Records
Tax History Compared to Growth
Tax History
| Year | Tax Paid | Tax Assessment Tax Assessment Total Assessment is a certain percentage of the fair market value that is determined by local assessors to be the total taxable value of land and additions on the property. | Land | Improvement |
|---|---|---|---|---|
| 2024 | $9,892 | $39,450 | $7,075 | $32,375 |
| 2023 | $10,172 | $39,450 | $7,075 | $32,375 |
| 2022 | $10,172 | $42,000 | $7,075 | $34,925 |
| 2021 | $9,360 | $34,424 | $5,527 | $28,897 |
| 2020 | $9,185 | $34,424 | $5,527 | $28,897 |
| 2019 | $9,153 | $38,292 | $5,527 | $32,765 |
| 2018 | $8,695 | $33,232 | $4,864 | $28,368 |
| 2017 | $8,610 | $33,232 | $4,864 | $28,368 |
| 2016 | $8,267 | $33,232 | $4,864 | $28,368 |
| 2015 | $10,315 | $37,559 | $4,200 | $33,359 |
| 2014 | $10,030 | $37,559 | $4,200 | $33,359 |
| 2013 | $9,761 | $37,559 | $4,200 | $33,359 |
Source: Public Records
Map
Nearby Homes
- 222 S Dwyer Ave
- 12 S Princeton Ct
- 24 S Kaspar Ave
- 316 S Reuter Dr
- 34 N Reuter Dr
- 1419 W Miner St
- 1615 W Johanna Terrace
- 1418 W Saint James Place
- 502 S Reuter Dr
- 105 S Mitchell Ave
- 2100 Martin Ln
- 514 W Miner St Unit 2F
- 318 W Wing St
- 2201 Kingfisher Ln
- 314 W Wing St
- 2306 Kingfisher Ln
- 3206 Kingfisher Ct
- 751 S Dwyer Ave Unit F
- 617 N Wilke Rd
- 151 W Wing St Unit 301
- 119 S Harvard Ave
- 129 S Harvard Ave Unit C
- 115 S Harvard Ave
- 203 S Harvard Ave
- 126 S Dwyer Ave
- 132 S Dwyer Ave
- 120 S Dwyer Ave
- 202 S Dwyer Ave
- 114 S Dwyer Ave
- 126 S Harvard Ave
- 109 S Harvard Ave
- 209 S Harvard Ave
- 120 S Harvard Ave
- 200 S Harvard Ave
- 116 S Harvard Ave Unit C
- 208 S Dwyer Ave
- 108 S Dwyer Ave
- 204 S Harvard Ave
- 110 S Harvard Ave Unit C
- 213 S Harvard Ave Unit C