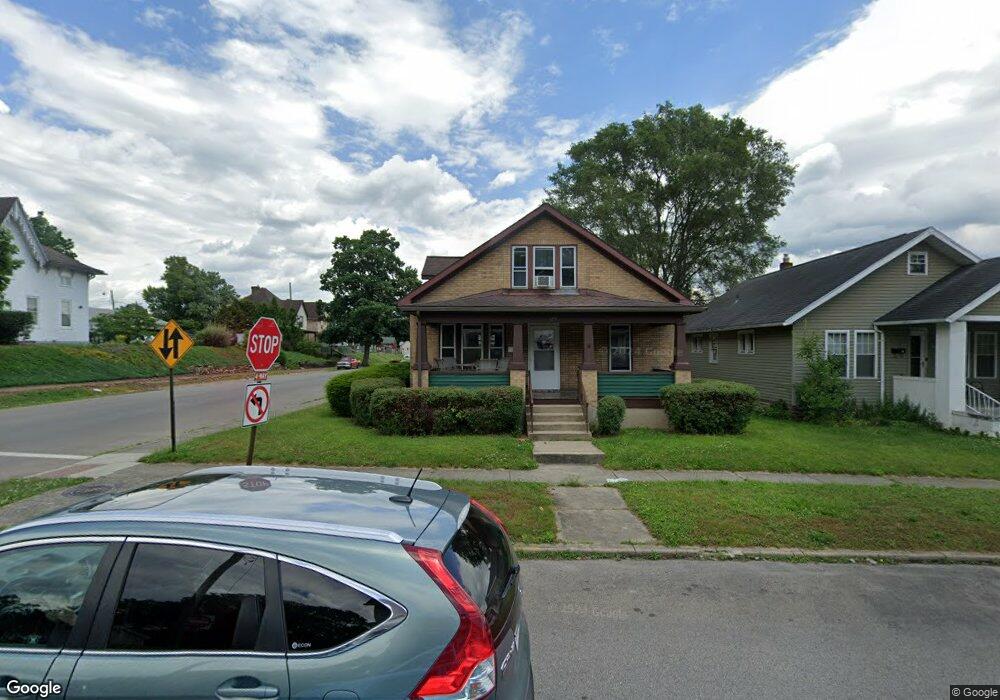
123 S Hickory St Chillicothe, OH 45601
Estimated Value: $109,000 - $142,000
2
Beds
1
Bath
1,024
Sq Ft
$119/Sq Ft
Est. Value
About This Home
This home is located at 123 S Hickory St, Chillicothe, OH 45601 and is currently estimated at $121,824, approximately $118 per square foot. 123 S Hickory St is a home located in Ross County with nearby schools including Chillicothe High School, Bishop Flaget School, and Wesley Taylor Preparatory School.
Ownership History
Date
Name
Owned For
Owner Type
Purchase Details
Closed on
Dec 5, 2019
Sold by
Simmons Carvel E
Bought by
Carvel & Charmel Simmons Co Llc
Current Estimated Value
Purchase Details
Closed on
Dec 14, 2017
Sold by
Steiner Cyrissa Graves and Graves Melissa A
Bought by
Simmons Carvel E and Carvel E Simmons Revocable Trust
Home Financials for this Owner
Home Financials are based on the most recent Mortgage that was taken out on this home.
Original Mortgage
$40,000
Outstanding Balance
$33,642
Interest Rate
3.9%
Mortgage Type
Commercial
Estimated Equity
$88,182
Create a Home Valuation Report for This Property
The Home Valuation Report is an in-depth analysis detailing your home's value as well as a comparison with similar homes in the area
Home Values in the Area
Average Home Value in this Area
Purchase History
| Date | Buyer | Sale Price | Title Company |
|---|---|---|---|
| Carvel & Charmel Simmons Co Llc | -- | None Available | |
| Simmons Carvel E | $12,250 | None Available |
Source: Public Records
Mortgage History
| Date | Status | Borrower | Loan Amount |
|---|---|---|---|
| Open | Simmons Carvel E | $40,000 |
Source: Public Records
Tax History Compared to Growth
Tax History
| Year | Tax Paid | Tax Assessment Tax Assessment Total Assessment is a certain percentage of the fair market value that is determined by local assessors to be the total taxable value of land and additions on the property. | Land | Improvement |
|---|---|---|---|---|
| 2024 | $1,148 | $28,130 | $3,060 | $25,070 |
| 2023 | $1,148 | $28,130 | $3,060 | $25,070 |
| 2022 | $1,168 | $28,130 | $3,060 | $25,070 |
| 2021 | $1,187 | $25,060 | $2,940 | $22,120 |
| 2020 | $1,187 | $25,060 | $2,940 | $22,120 |
| 2019 | $1,188 | $25,060 | $2,940 | $22,120 |
| 2018 | $1,079 | $21,550 | $2,940 | $18,610 |
| 2017 | $674 | $21,550 | $2,940 | $18,610 |
| 2016 | $667 | $21,550 | $2,940 | $18,610 |
| 2015 | $588 | $19,770 | $2,940 | $16,830 |
| 2014 | $575 | $19,770 | $2,940 | $16,830 |
| 2013 | $576 | $19,770 | $2,940 | $16,830 |
Source: Public Records
Map
Nearby Homes