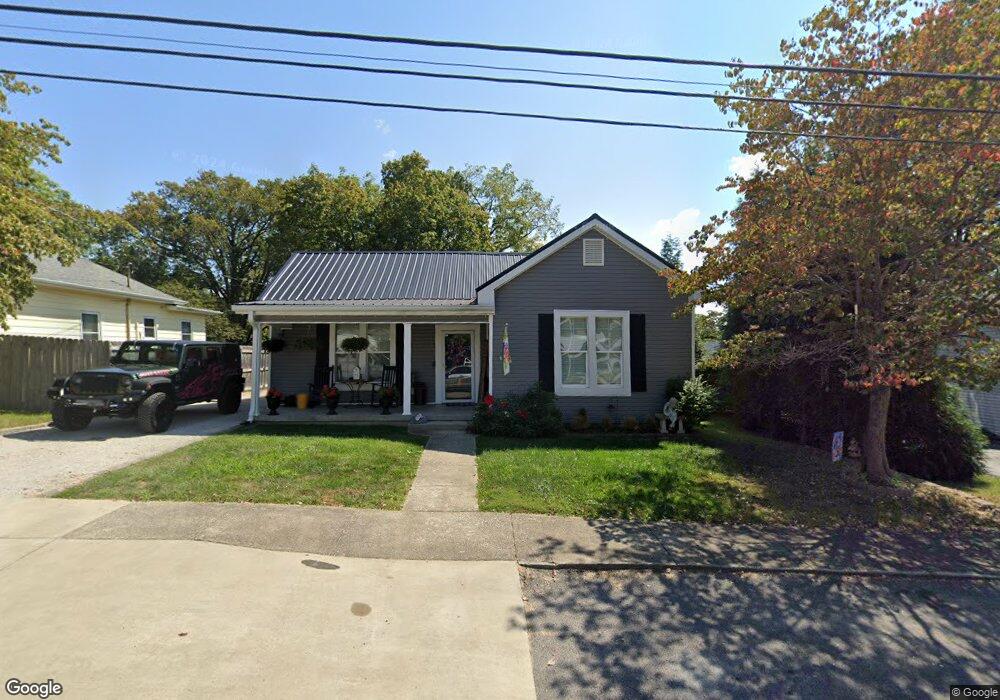
123 S Maple St Elizabethtown, KY 42701
Estimated Value: $206,709 - $215,000
3
Beds
1
Bath
1,432
Sq Ft
$147/Sq Ft
Est. Value
About This Home
This home is located at 123 S Maple St, Elizabethtown, KY 42701 and is currently estimated at $210,177, approximately $146 per square foot. 123 S Maple St is a home located in Hardin County with nearby schools including Elizabethtown High School, New Beginnings Christian Academy, and Academy of Learning - Elizabethtown.
Ownership History
Date
Name
Owned For
Owner Type
Purchase Details
Closed on
Aug 31, 2024
Sold by
Horn Daniel and Jacobi Brian
Bought by
Greenwell Robert and Greenwell Mary
Current Estimated Value
Home Financials for this Owner
Home Financials are based on the most recent Mortgage that was taken out on this home.
Original Mortgage
$130,000
Interest Rate
5.75%
Mortgage Type
New Conventional
Purchase Details
Closed on
Sep 2, 2010
Sold by
Beneficial Kentucky Inc
Bought by
Jacobi Brian and Jacobi Diana
Home Financials for this Owner
Home Financials are based on the most recent Mortgage that was taken out on this home.
Original Mortgage
$31,450
Interest Rate
4.52%
Mortgage Type
Future Advance Clause Open End Mortgage
Purchase Details
Closed on
Mar 23, 2010
Sold by
Vergara David P and Vergara Maria I
Bought by
Beneficial Kentucky Inc and Beneficial Mortgage Co Of Kentucky
Create a Home Valuation Report for This Property
The Home Valuation Report is an in-depth analysis detailing your home's value as well as a comparison with similar homes in the area
Home Values in the Area
Average Home Value in this Area
Purchase History
| Date | Buyer | Sale Price | Title Company |
|---|---|---|---|
| Greenwell Robert | $190,000 | None Listed On Document | |
| Greenwell Robert | $190,000 | None Listed On Document | |
| Jacobi Brian | $37,000 | None Available | |
| Beneficial Kentucky Inc | -- | None Available |
Source: Public Records
Mortgage History
| Date | Status | Borrower | Loan Amount |
|---|---|---|---|
| Previous Owner | Greenwell Robert | $130,000 | |
| Previous Owner | Jacobi Brian | $31,450 |
Source: Public Records
Tax History Compared to Growth
Tax History
| Year | Tax Paid | Tax Assessment Tax Assessment Total Assessment is a certain percentage of the fair market value that is determined by local assessors to be the total taxable value of land and additions on the property. | Land | Improvement |
|---|---|---|---|---|
| 2024 | $1,735 | $143,400 | $17,300 | $126,100 |
| 2023 | $1,735 | $143,400 | $17,300 | $126,100 |
| 2022 | $1,263 | $95,400 | $17,300 | $78,100 |
| 2021 | $1,221 | $95,400 | $17,300 | $78,100 |
| 2020 | $1,210 | $95,400 | $17,300 | $78,100 |
| 2019 | $75 | $95,400 | $0 | $0 |
| 2018 | $800 | $65,000 | $0 | $0 |
| 2017 | $781 | $65,000 | $0 | $0 |
| 2016 | $0 | $65,000 | $0 | $0 |
| 2015 | $644 | $65,000 | $0 | $0 |
| 2012 | -- | $65,000 | $0 | $0 |
Source: Public Records
Map
Nearby Homes
- 310 W Dixie Ave
- 402 Pennsylvania Ave
- 206 Terry Ct
- 207 Hillcrest Dr
- 116 S Mantle Ave
- 224 N Miles St
- 308 Meadow Ln
- 230 N Miles St
- 329 Robin Rd
- 103 Freeman Green Dr Unit 3C BLDG B
- 103 Freeman Green Dr Unit 1B
- 103 Freeman Green Dr Unit 2A
- 103 Apt 1B Freeman Green Dr
- 133 W Dixie Ave
- 310 Jefferson St
- 300 Fall Creek Ln
- 100 Cozy Ct
- 310 A/B Jefferson St
- 109 W Poplar St
- 306 Hardin St