123 Sherron Dr Dickson, TN 37055
Estimated Value: $246,718 - $280,000
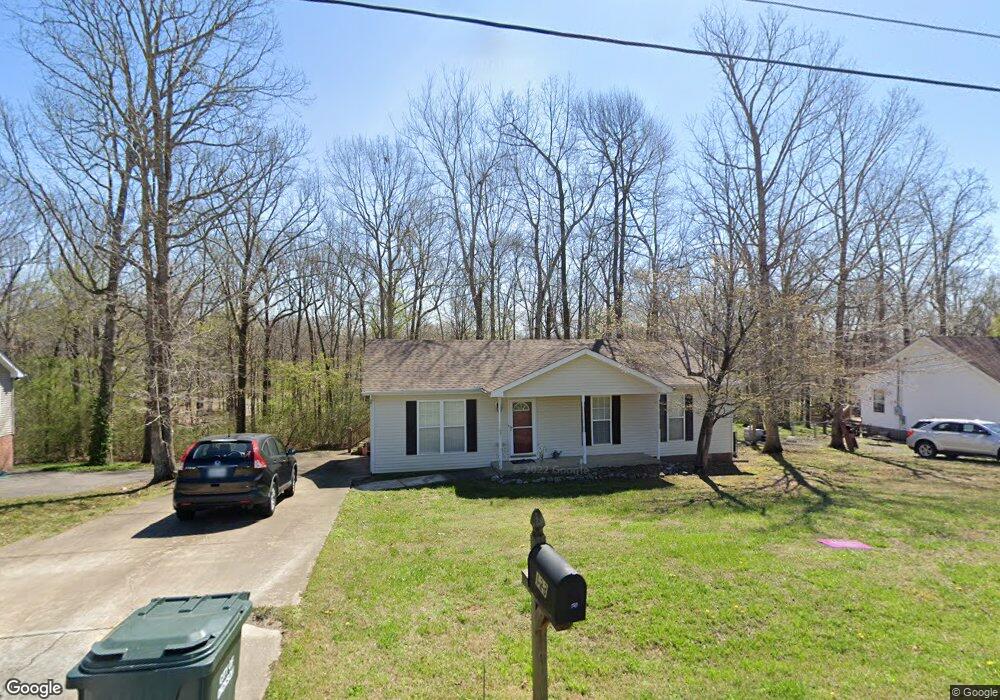
About This Home
This home is located at 123 Sherron Dr, Dickson, TN 37055 and is currently estimated at $260,430, approximately $235 per square foot. 123 Sherron Dr is a home located in Dickson County with nearby schools including Dickson Elementary School, Dickson Middle School, and Dickson County High School.
Ownership History
We collect this data history from publicly available records. To have your information removed, we recommend requesting removal directly through your county’s website.
Purchase Details
Home Financials for this Owner
Home Financials are based on the most recent Mortgage that was taken out on this home.Purchase Details
Purchase Details
Purchase Details
Home Values in the Area
Average Home Value in this Area
Purchase History
We collect this data history from publicly available records. To have your information removed, we recommend requesting removal directly through your county’s website.
| Date | Buyer | Sale Price | Title Company |
|---|---|---|---|
| $99,000 | -- | ||
| $93,000 | -- | ||
| $85,000 | -- | ||
| -- | -- |
Mortgage History
We collect this data history from publicly available records. To have your information removed, we recommend requesting removal directly through your county’s website.
| Date | Status | Borrower | Loan Amount |
|---|---|---|---|
| Open | $104,000 |
Tax History
We collect this data history from publicly available records. To have your information removed, we recommend requesting removal directly through your county’s website.
| Year | Tax Paid | Tax Assessment Tax Assessment Total Assessment is a certain percentage of the fair market value that is determined by local assessors to be the total taxable value of land and additions on the property. | Land | Improvement |
|---|---|---|---|---|
| 2025 | -- | $52,200 | $12,500 | $39,700 |
| 2024 | -- | $52,200 | $12,500 | $39,700 |
| 2023 | $1,111 | $35,575 | $6,450 | $29,125 |
| 2022 | $1,111 | $35,575 | $6,450 | $29,125 |
| 2021 | $1,111 | $35,575 | $6,450 | $29,125 |
| 2020 | $1,111 | $35,575 | $6,450 | $29,125 |
| 2019 | $1,111 | $35,575 | $6,450 | $29,125 |
| 2018 | $1,054 | $28,875 | $5,750 | $23,125 |
| 2017 | $1,054 | $28,875 | $5,750 | $23,125 |
| 2016 | $1,054 | $28,875 | $5,750 | $23,125 |
| 2015 | $976 | $25,150 | $5,750 | $19,400 |
| 2014 | $976 | $25,150 | $5,750 | $19,400 |
Map
- 712 Highway 48 S
- 0 W Walnut St
- 501 W Chestnut St
- 701 W 5th St
- 0 Furnace Hollow Rd
- 0 Furnace Hollow Rd Unit 5
- 430 Center Ave
- 122 Payne Springs Rd
- 1015 Pin Oak Dr
- 1025 Northside Dr
- 0 Hardin Ave
- 210 Hardin Ave
- 2620 Highway 48 S
- 0 W First St Unit 22
- 212 W End Ave
- 110 Acorn Dr
- 300 W Railroad St
- 1118 W 1st St
- 207 Scott St
- 904 Highway 48 S
Ask me questions while you tour the home.