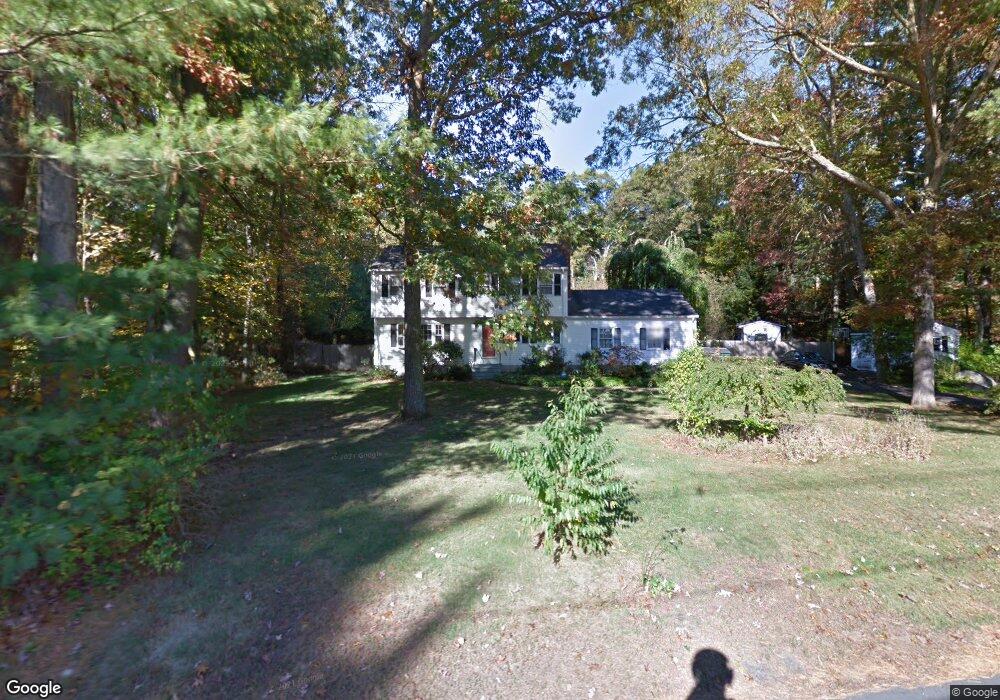
123 South St Holliston, MA 01746
Estimated Value: $727,000 - $876,000
4
Beds
3
Baths
2,106
Sq Ft
$383/Sq Ft
Est. Value
About This Home
This home is located at 123 South St, Holliston, MA 01746 and is currently estimated at $806,077, approximately $382 per square foot. 123 South St is a home located in Middlesex County with nearby schools including Miller Elementary School, Robert H. Adams Middle School, and Holliston High School.
Ownership History
Date
Name
Owned For
Owner Type
Purchase Details
Closed on
Nov 16, 2000
Sold by
Stromberg John F and Stromberg Glee E
Bought by
Marra Anthony N and Marra Gail N
Current Estimated Value
Home Financials for this Owner
Home Financials are based on the most recent Mortgage that was taken out on this home.
Original Mortgage
$212,000
Outstanding Balance
$77,560
Interest Rate
7.78%
Mortgage Type
Purchase Money Mortgage
Estimated Equity
$728,517
Purchase Details
Closed on
May 17, 1993
Sold by
Marsden Alexander and Marsden Doris B
Bought by
Stromberg John F and Stromberg Glee E
Create a Home Valuation Report for This Property
The Home Valuation Report is an in-depth analysis detailing your home's value as well as a comparison with similar homes in the area
Home Values in the Area
Average Home Value in this Area
Purchase History
| Date | Buyer | Sale Price | Title Company |
|---|---|---|---|
| Marra Anthony N | $322,500 | -- | |
| Stromberg John F | $228,000 | -- |
Source: Public Records
Mortgage History
| Date | Status | Borrower | Loan Amount |
|---|---|---|---|
| Open | Stromberg John F | $29,000 | |
| Open | Stromberg John F | $212,000 |
Source: Public Records
Tax History Compared to Growth
Tax History
| Year | Tax Paid | Tax Assessment Tax Assessment Total Assessment is a certain percentage of the fair market value that is determined by local assessors to be the total taxable value of land and additions on the property. | Land | Improvement |
|---|---|---|---|---|
| 2025 | $9,688 | $661,300 | $311,200 | $350,100 |
| 2024 | $9,733 | $646,300 | $311,200 | $335,100 |
| 2023 | $8,987 | $583,600 | $311,200 | $272,400 |
| 2022 | $9,684 | $557,200 | $311,200 | $246,000 |
| 2021 | $8,889 | $498,000 | $252,000 | $246,000 |
| 2020 | $8,454 | $448,500 | $224,800 | $223,700 |
| 2019 | $8,146 | $432,600 | $218,400 | $214,200 |
| 2018 | $8,077 | $432,600 | $218,400 | $214,200 |
| 2017 | $8,488 | $458,300 | $209,600 | $248,700 |
| 2016 | $7,911 | $421,000 | $183,200 | $237,800 |
| 2015 | $7,570 | $390,600 | $157,600 | $233,000 |
Source: Public Records
Map
Nearby Homes
- 56 Paul Rd
- 85 Fisher St
- 78 Fisher St
- 15 Broad Acres Farm Rd
- 4 Deerfield Rd
- 6 Rainbow Dr
- 190-194 E Main St
- 12 Longmeadow Ln
- 4 E Charles St
- Lot 2 Hanlon Rd
- 75 Ridge Rd
- 22 Granite St
- 15 Free St
- Lot 1 Florence St
- 9 Tulip Way
- 39 West St
- 17 Middleton St
- 35 Woodland Ave Unit 35A
- 6 Freedom Trail
- 116 Winthrop St