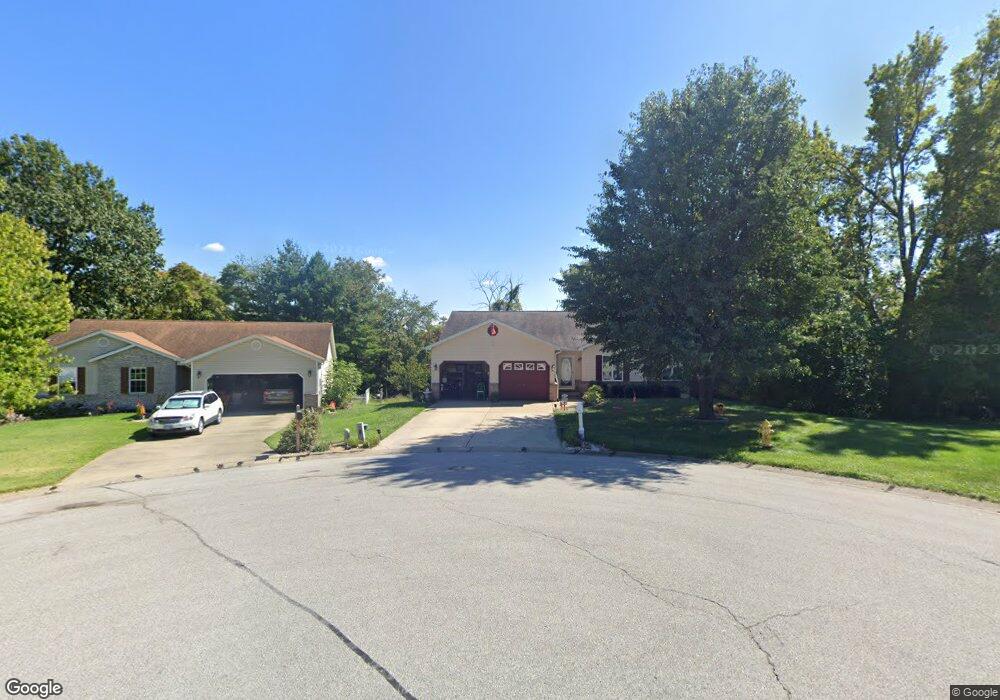
123 Southwood Trace Collinsville, IL 62234
Estimated Value: $282,000 - $313,000
--
Bed
--
Bath
1,824
Sq Ft
$160/Sq Ft
Est. Value
About This Home
This home is located at 123 Southwood Trace, Collinsville, IL 62234 and is currently estimated at $291,542, approximately $159 per square foot. 123 Southwood Trace is a home located in St. Clair County with nearby schools including Twin Echo Elementary School, Dorris Intermediate School, and Collinsville Middle School.
Ownership History
Date
Name
Owned For
Owner Type
Purchase Details
Closed on
Aug 1, 2023
Sold by
Beckham Bo R and Beckham Deeanna M
Bought by
Beckham Deeanna M
Current Estimated Value
Home Financials for this Owner
Home Financials are based on the most recent Mortgage that was taken out on this home.
Original Mortgage
$214,082
Outstanding Balance
$208,032
Interest Rate
5.63%
Mortgage Type
FHA
Estimated Equity
$83,510
Purchase Details
Closed on
Aug 12, 2005
Sold by
Ditzler John G and Ditzler Alicia A
Bought by
Beckham Bo R and Beckham Deeanna M
Home Financials for this Owner
Home Financials are based on the most recent Mortgage that was taken out on this home.
Original Mortgage
$141,520
Interest Rate
5.66%
Mortgage Type
Fannie Mae Freddie Mac
Create a Home Valuation Report for This Property
The Home Valuation Report is an in-depth analysis detailing your home's value as well as a comparison with similar homes in the area
Home Values in the Area
Average Home Value in this Area
Purchase History
| Date | Buyer | Sale Price | Title Company |
|---|---|---|---|
| Beckham Deeanna M | -- | None Available | |
| Beckham Bo R | -- | Abstracts & Titles Inc |
Source: Public Records
Mortgage History
| Date | Status | Borrower | Loan Amount |
|---|---|---|---|
| Open | Beckham Deeanna M | $214,082 | |
| Previous Owner | Beckham Bo R | $141,520 |
Source: Public Records
Tax History Compared to Growth
Tax History
| Year | Tax Paid | Tax Assessment Tax Assessment Total Assessment is a certain percentage of the fair market value that is determined by local assessors to be the total taxable value of land and additions on the property. | Land | Improvement |
|---|---|---|---|---|
| 2024 | $4,984 | $82,416 | $11,412 | $71,004 |
| 2023 | $4,677 | $72,921 | $10,097 | $62,824 |
| 2022 | $4,043 | $64,107 | $9,895 | $54,212 |
| 2021 | $3,956 | $60,846 | $9,392 | $51,454 |
| 2020 | $3,884 | $57,637 | $8,897 | $48,740 |
| 2019 | $3,777 | $57,637 | $8,897 | $48,740 |
| 2018 | $3,697 | $56,293 | $8,809 | $47,484 |
| 2017 | $3,720 | $54,009 | $8,451 | $45,558 |
| 2016 | $3,784 | $52,789 | $8,260 | $44,529 |
| 2014 | $3,593 | $53,770 | $9,292 | $44,478 |
| 2013 | $3,807 | $54,761 | $9,463 | $45,298 |
Source: Public Records
Map
Nearby Homes
- 1109 Saint Clair Ave
- 8038 Tahoe Ridge
- 208 Coral Dr
- Lot 20 Jefferson Ave
- 8026 Tahoe Ridge
- 804 Carl St
- 0 Tahoe Ridge Subdivision
- Lot 36 Jefferson Ave
- 128 Courtland Place
- Lot 37 Jefferson Ave
- 116 Moffett Ave
- Lot 38 Jefferson Ave
- 114 Moffett Ave Unit 116
- Lot 32 Jefferson Ave
- 202 Keeneland Ct
- 1134 Elbow Hill Ct
- 820 Bond Ave
- 1130 Elbow Hill Ct
- 746 Maple St
- 0 Walker Meadows Subdivision
- 121 Southwood Trace
- 125 Southwood Trace
- 119 Southwood Trace
- 1809 S Morrison Ave
- 1809 S Morrison Ave
- 103 Woods End
- 117 Southwood Trace
- 116 Southwood Trace
- 105 Woods End
- 114 Southwood Trace
- 102 Woods End
- 107 Woods End
- 111 Southwood Trace
- 112 Southwood Trace
- 104 Woods End
- 922 Southwind Ct
- 109 Woods End
- 923 Southwind Ct
- 106 Woods End
- 109 Southwood Trace