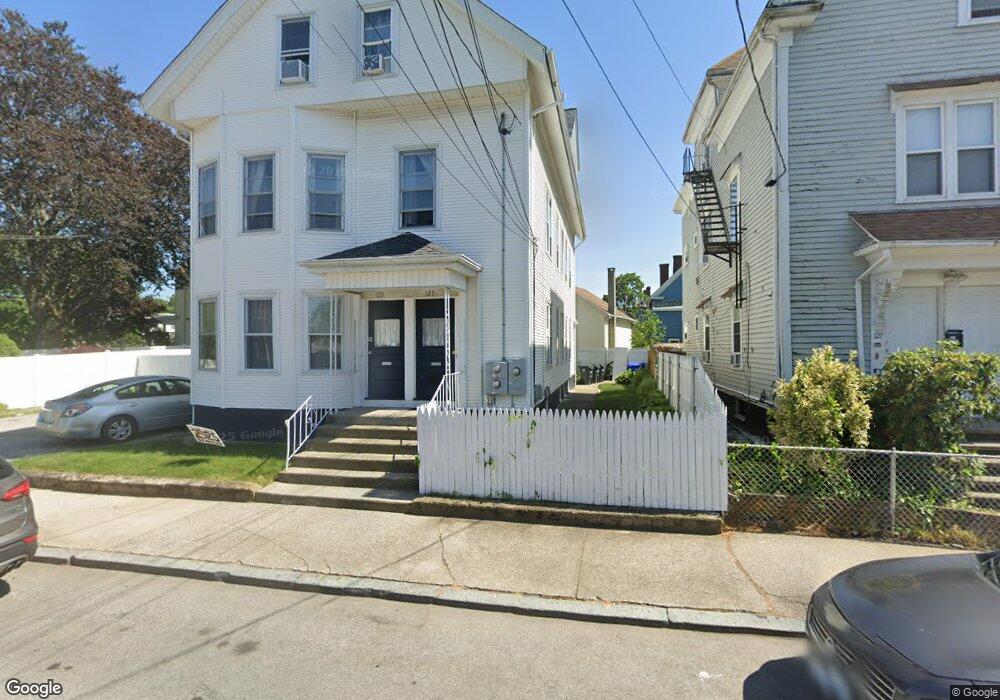
123 Spring St Pawtucket, RI 02860
Pleasant View NeighborhoodEstimated Value: $555,000 - $657,000
7
Beds
3
Baths
3,604
Sq Ft
$171/Sq Ft
Est. Value
About This Home
This home is located at 123 Spring St, Pawtucket, RI 02860 and is currently estimated at $616,667, approximately $171 per square foot. 123 Spring St is a home located in Providence County with nearby schools including International Charter School, St Cecilia School, and Saint Raphael Academy.
Ownership History
Date
Name
Owned For
Owner Type
Purchase Details
Closed on
Jul 3, 2023
Sold by
Deburgo Artur C and Deburgo Elizia M
Bought by
Deburgo Ft and Deburgo
Current Estimated Value
Purchase Details
Closed on
Feb 11, 2019
Sold by
Pawtucket Water Supply
Bought by
Deburgo Alberto J and De Burgo Artur
Purchase Details
Closed on
Feb 13, 1996
Sold by
Lawrence Antonio and Lawrence Mary
Bought by
Deburgo Artur C and Deburgo Elisia
Create a Home Valuation Report for This Property
The Home Valuation Report is an in-depth analysis detailing your home's value as well as a comparison with similar homes in the area
Home Values in the Area
Average Home Value in this Area
Purchase History
| Date | Buyer | Sale Price | Title Company |
|---|---|---|---|
| Deburgo Ft | -- | None Available | |
| Deburgo Alberto J | $1,518 | -- | |
| Deburgo Artur C | $65,000 | -- |
Source: Public Records
Tax History
| Year | Tax Paid | Tax Assessment Tax Assessment Total Assessment is a certain percentage of the fair market value that is determined by local assessors to be the total taxable value of land and additions on the property. | Land | Improvement |
|---|---|---|---|---|
| 2025 | $6,421 | $488,300 | $104,200 | $384,100 |
| 2024 | $6,026 | $488,300 | $104,200 | $384,100 |
| 2023 | $5,841 | $344,800 | $60,400 | $284,400 |
| 2022 | $5,717 | $344,800 | $60,400 | $284,400 |
| 2021 | $5,717 | $344,800 | $60,400 | $284,400 |
| 2020 | $4,537 | $217,200 | $50,300 | $166,900 |
| 2019 | $4,537 | $217,200 | $50,300 | $166,900 |
| 2018 | $4,372 | $217,200 | $50,300 | $166,900 |
| 2017 | $4,215 | $185,500 | $40,600 | $144,900 |
| 2016 | $4,061 | $185,500 | $40,600 | $144,900 |
| 2015 | $4,061 | $185,500 | $40,600 | $144,900 |
| 2014 | $3,108 | $134,800 | $40,600 | $94,200 |
Source: Public Records
Map
Nearby Homes
Your Personal Tour Guide
Ask me questions while you tour the home.