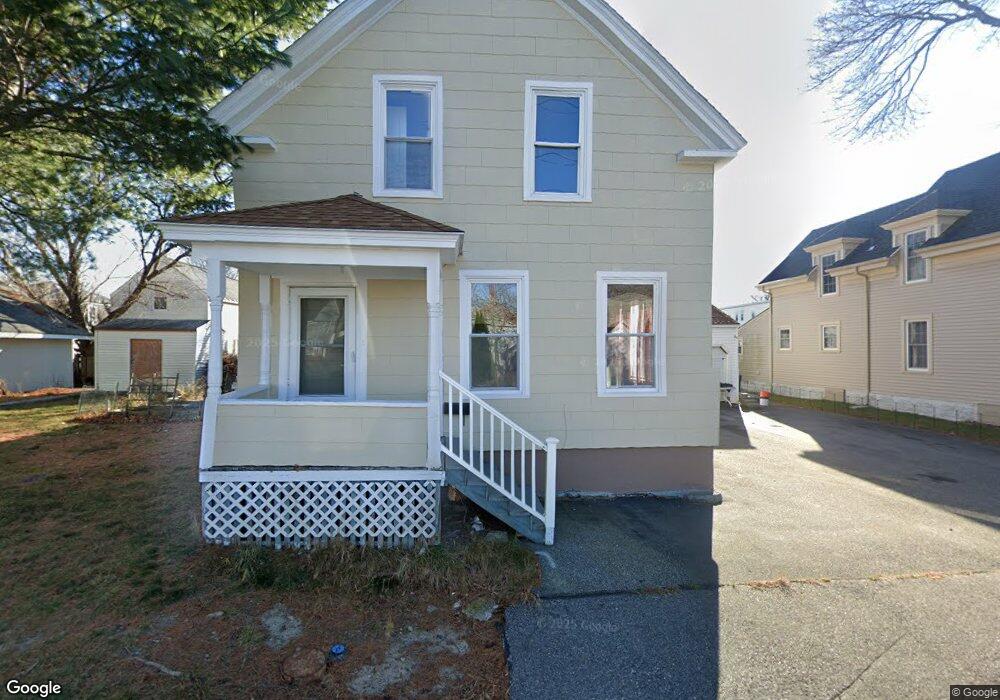
123 Summer St Biddeford, ME 04005
Estimated Value: $367,170 - $413,000
5
Beds
2
Baths
1,850
Sq Ft
$212/Sq Ft
Est. Value
About This Home
This home is located at 123 Summer St, Biddeford, ME 04005 and is currently estimated at $392,793, approximately $212 per square foot. 123 Summer St is a home located in York County with nearby schools including John F Kennedy Memorial School, Biddeford Primary School, and Biddeford Intermediate School.
Ownership History
Date
Name
Owned For
Owner Type
Purchase Details
Closed on
Aug 2, 2024
Sold by
Dionne David J and Dionne Cindy L
Bought by
Richardson Casey
Current Estimated Value
Create a Home Valuation Report for This Property
The Home Valuation Report is an in-depth analysis detailing your home's value as well as a comparison with similar homes in the area
Home Values in the Area
Average Home Value in this Area
Purchase History
| Date | Buyer | Sale Price | Title Company |
|---|---|---|---|
| Richardson Casey | $280,000 | None Available | |
| Richardson Casey | $280,000 | None Available |
Source: Public Records
Tax History Compared to Growth
Tax History
| Year | Tax Paid | Tax Assessment Tax Assessment Total Assessment is a certain percentage of the fair market value that is determined by local assessors to be the total taxable value of land and additions on the property. | Land | Improvement |
|---|---|---|---|---|
| 2024 | $3,467 | $243,800 | $137,500 | $106,300 |
| 2023 | $3,166 | $241,300 | $135,000 | $106,300 |
| 2022 | $3,110 | $189,500 | $70,200 | $119,300 |
| 2021 | $2,939 | $161,200 | $59,400 | $101,800 |
| 2020 | $2,979 | $148,600 | $54,000 | $94,600 |
| 2019 | $2,969 | $148,600 | $54,000 | $94,600 |
| 2018 | $2,927 | $148,600 | $54,000 | $94,600 |
| 2017 | $2,838 | $141,400 | $54,000 | $87,400 |
| 2016 | $2,808 | $141,400 | $54,000 | $87,400 |
| 2015 | $2,558 | $141,400 | $54,000 | $87,400 |
| 2014 | $2,495 | $141,400 | $54,000 | $87,400 |
| 2013 | -- | $153,900 | $54,700 | $99,200 |
Source: Public Records
Map
Nearby Homes
- 155 Hill St
- 17 Granite St
- 99 Summer St
- 138 Summer St
- 7 Willett St
- 7 Oak St
- 109 Alfred Rd
- 84 Pike St
- 38 Westfield Extension
- 11 King St
- 38 Jefferson St
- 39 Green St
- 16 Hill St
- 38 South St
- 4 High St
- 2 Main St Unit 17-506
- 2 Main St Unit 15-310
- 2 Main St Unit 18-420
- 2 Main St Unit 17-410
- 2 Main St Unit 17-508