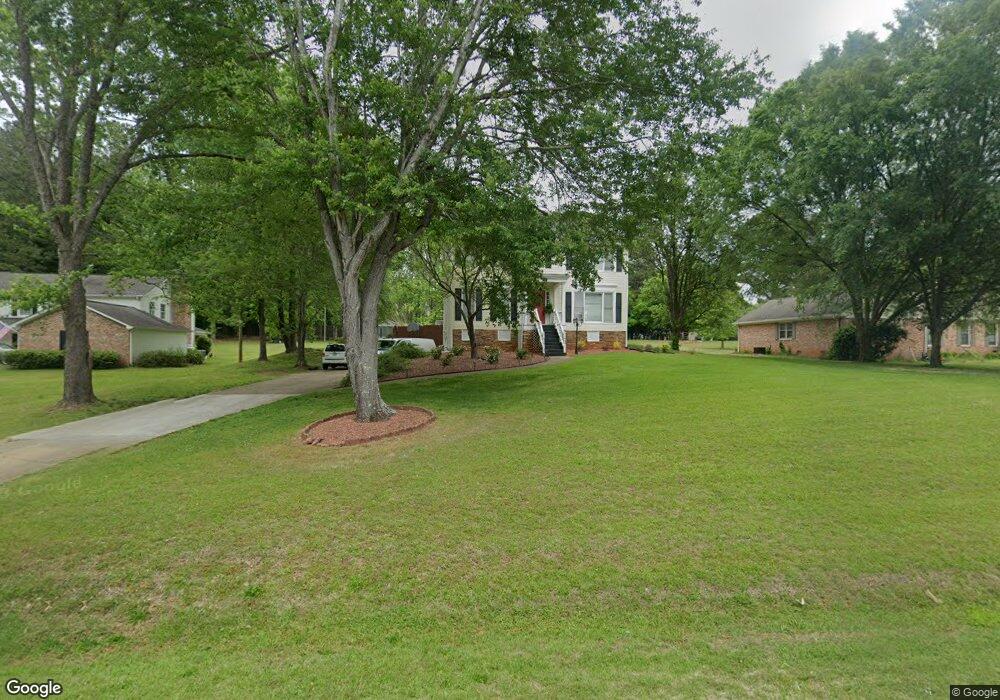
123 View Pointe Dr Lagrange, GA 30241
Estimated Value: $327,789 - $360,000
4
Beds
3
Baths
2,392
Sq Ft
$144/Sq Ft
Est. Value
About This Home
This home is located at 123 View Pointe Dr, Lagrange, GA 30241 and is currently estimated at $344,447, approximately $143 per square foot. 123 View Pointe Dr is a home with nearby schools including Hillcrest Elementary School, Franklin Forest Elementary School, and Hollis Hand Elementary School.
Ownership History
Date
Name
Owned For
Owner Type
Purchase Details
Closed on
Aug 3, 1998
Sold by
James A Daniel
Bought by
Livingston James S and Livingston Jessica
Current Estimated Value
Purchase Details
Closed on
Sep 15, 1997
Sold by
Edwards Diane and Edwards Kenneth L
Bought by
James A Daniel
Purchase Details
Closed on
Jun 1, 1994
Sold by
Kenneth L Edwards
Bought by
Edwards Diane and Edwards Kenneth L
Purchase Details
Closed on
Apr 18, 1994
Sold by
Diane Terry
Bought by
Kenneth L Edwards
Purchase Details
Closed on
Aug 10, 1989
Sold by
William William B and William Sabine
Bought by
Diane Terry
Purchase Details
Closed on
Apr 1, 1986
Sold by
C Lane Const Co Inc
Bought by
William William B and William Sabine
Purchase Details
Closed on
Dec 13, 1984
Sold by
Fred Alewine
Bought by
C Lane Const Co Inc
Purchase Details
Closed on
May 26, 1949
Bought by
Fred Alewine
Create a Home Valuation Report for This Property
The Home Valuation Report is an in-depth analysis detailing your home's value as well as a comparison with similar homes in the area
Purchase History
| Date | Buyer | Sale Price | Title Company |
|---|---|---|---|
| Livingston James S | $137,500 | -- | |
| James A Daniel | $125,000 | -- | |
| Edwards Diane | -- | -- | |
| Kenneth L Edwards | -- | -- | |
| Diane Terry | $107,000 | -- | |
| William William B | $107,500 | -- | |
| C Lane Const Co Inc | $8,500 | -- | |
| Fred Alewine | -- | -- |
Source: Public Records
Tax History
| Year | Tax Paid | Tax Assessment Tax Assessment Total Assessment is a certain percentage of the fair market value that is determined by local assessors to be the total taxable value of land and additions on the property. | Land | Improvement |
|---|---|---|---|---|
| 2025 | $3,544 | $133,696 | $14,000 | $119,696 |
| 2024 | $2,871 | $107,256 | $14,000 | $93,256 |
| 2023 | $2,783 | $104,016 | $14,000 | $90,016 |
| 2022 | $2,727 | $99,696 | $14,000 | $85,696 |
| 2021 | $2,097 | $71,512 | $10,000 | $61,512 |
| 2020 | $2,097 | $71,512 | $10,000 | $61,512 |
| 2019 | $1,960 | $66,984 | $8,000 | $58,984 |
| 2018 | $1,719 | $58,988 | $6,400 | $52,588 |
| 2017 | $1,719 | $58,988 | $6,400 | $52,588 |
| 2016 | $1,720 | $59,004 | $6,400 | $52,604 |
| 2015 | $1,723 | $59,004 | $6,400 | $52,604 |
| 2014 | $1,642 | $56,236 | $6,400 | $49,836 |
| 2013 | -- | $59,443 | $6,400 | $53,043 |
Source: Public Records
Map
Nearby Homes
- 207 N View Pointe Dr
- 203 N View Pointe Dr
- 203 View Pointe Ln
- 104 Canterbury Dr
- 100 Canterbury Dr
- 405 Canterbury Dr
- 101 Sheffield Dr
- 209 River Oaks Dr
- 24 N Brooks Rd
- 91 Richmond Dr
- 205 River Oaks Dr
- 109 Windridge
- 107 Windridge
- 103 Windridge
- 114 Red Oak Trail
- 0 Waterview Dr Unit 10558462
- 103 Woodchase
- 178 Waterview Dr
- 130 Sunny Point Cir
- 115 Meadowland Trail
- 121 View Pointe Dr
- 125 View Pointe Dr
- 129 View Pointe Dr
- 119 View Pointe Dr
- 133 View Pointe Dr
- 117 View Pointe Dr
- 212 N View Pointe Dr
- 206 N View Pointe Dr
- 208 N View Pointe Dr
- 116 View Pointe Dr
- 115 View Pointe Dr
- 204 N View Pointe Dr
- 134 View Pointe Dr
- 114 View Pointe Dr
- 204 N View Pointe Dr
- 120 View Pointe Dr
- N N View Pointe Dr
- 138 View Pointe Dr
- 136 View Pointe Dr
- 122 View Pointe Dr
Your Personal Tour Guide
Ask me questions while you tour the home.